Sunday, December 24, 2006

Nifty for 22 Dec 06


These are my personal musings. These are not in any way meant to be trading advise. To view the full chart, right click and open in a new window.

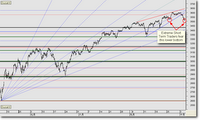
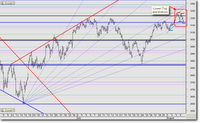
The volatility is increasing. The Nifty has just encountered another resistance overhead. Normally, on the weekend, positions are closed, so it is quite probable that bears could have exited in the last half hour, giving rise to the Nifty.

I had expected the downside to continue on Friday too, but that did not happen.

I am still of the opinion that we should see one more round of selling. 3770 would be a good level for us to gauge the short term trend. A break on the downside would be a good indicator that the short term trend is indeed down.

Trade happy.

Friday, December 22, 2006

Nifty for 21 Dec 06


These are my personal musings. These are not in any way meant to be trading advise. To view the full chart, right click and open in a new window.

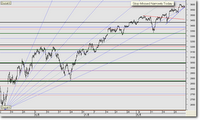
Nothing seems to have changed since yesterday. Except for the volatility. The Nifty is struggling with the resistances overhead. At the same time, it is also receiving good support.

There should have been enough strength today, which should have allowed the Nifty to break its shackles. However, it has failed.

Therefore, please expect a downside. This downside could again retest the 3650 levels, and in all probability, it could also be penetrated. This could turn out to be a classic bear trap.

Trade happy.

Wednesday, December 20, 2006

Nifty for 20 Dec 06


These are my personal musings. These are not in any way meant to be trading advise. To view the full chart, right click and open in a new window.

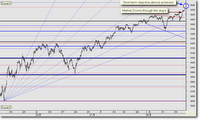
From the chart of today, it already seems that the bad news of yesterday has been discounted, and the market is readying to make another surge upward.

On the chart, I have marked out the few operative congestion zones established during the last few days. These levels are now going to play a major role in the market movement.

If I am asked to stick my neck out, I would think that the market has made a corrective bottom here, and the trend should resume towards its original direction, that is upwards.

This is assumed by the continuous bounces, not only on the Nifty, but also on the CNXIT and Bank Nifty Futures.

All said and done, in volatile times, it is always advisable to hedge positions rather than being naked long. But those among us who are adventurous, could try their hand at bottom fishing.

Trade happy.

Tuesday, December 19, 2006

Nifty for 19 Dec 06


These are my personal musings. These are not in any way meant to be trading advise. To view the full chart, right click and open in a new window.

As suggested yesterday, we could see some blood letting on the bourses. And it seems to have happened. The fundamental reason could be the news that Iran wants to shift its trading and reserves to the Euro, instead of the Dollar.

In such a scenario, hedge funds would want to withdraw from uncertainties and speculate on the currencies. This could be a reason why such a sudden fall has happened.

Normally, when such an event happens, the market usually recovers after a gap of a week to a fortnight.

However, we are concerned only about the technicals. And the technicals suggest that the short term trend is down in the longer term uptrend. The lower tops and bottoms do suggest that.

The 3970 zone was not tested at all, as a result of which, we saw a sharp downside. Neither did the 3900 and 3850 levels provide support. So we could assume the trend to be down. In such a scenario, any upsides could be capped by additional selling at higher levels.

A trading plan would be extremely useful at this juncture.

Trade happy.

Nifty for 18 Dec 06


These are my personal musings. These are not in any way meant to be trading advise. To view the full chart, right click and open in a new window.

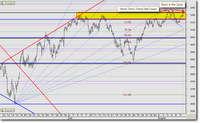
The Nifty is at a very interesting juncture. The last move up does seem like a correction to the previous fall.

It therefore becomes imperative that we approach this market with a strict view without any scope for complacency. I have marked out several zones on the chart which could be used as placing stops or buying zones, depending on the traders’ time horizon.

The 3970 zone could be tested, and then we may see some downside. If the 3900 and 3850 levels provide support, then we can assume that the trend will continue up. Or else, we could see some bloodshed on the bourses.

Trade happy.

Thursday, December 14, 2006

Nifty for 14 Dec 06

The chart says it all.
These are my personal musings. These are not in any way meant to be trading advise. To view the full chart, right click and open in a new window.
Watch out ... we may see a few hiccups tomorrow.
But it is my anticipation, that these hiccups could turn into non events.

Wednesday, December 13, 2006

Nifty for 13 Dec 06


These are my personal musings. These are not in any way meant to be trading advise. To view the full chart, right click and open in a new window.

It does seem that the Nifty has paused here.

The Bank Nifty, which did the most damage in the last two days, has also staged a resurgence. Further, on the chart, I have also included the 5 minutes chart in close-up. It does show a steady upward direction, with higher tops and bottoms. Therefore, in all probability, we have seen a most significant bottom yesterday.

The volumes on the Nifty Future also suggest the same.

On the chart, we see the several resistance zones which the Nifty needs to overcome, so the going is going to be tough. But, as suggested, the trend should continue upwards.

For investors, it could be suggested to take positions in market leaders, and Index components, as they would lead the sentiment. Look as the second rung stocks later.

For speculators, it could be suggested to hedge long positions as the Index may still give a few heart beat skips.

Trade happy.

Tuesday, December 12, 2006

Nifty for 12 Dec 06


These are my personal musings. These are not in any way meant to be trading advise. To view the full chart, right click and open in a new window.

At last an exciting day. There was enough volatility to shock both the bulls as well as the bears. The direction, nonetheless, was downwards.

A trader could be short on the breach of the earlier support zone of 3800. Now the earlier support zones are all going to turn into resistances.

There are two alternatives which present themselves to us. One is that the Nifty has bottomed today at the 3660 level, and we could see a slow retracement upwards. Please appreciate that any rise will be met with more selling, and the going is expected to take a huge effort from the bulls.

The second is that we could see the Nifty meeting resistance at the 3800 zone and then breach today’s bottom.

In that case, this sharp downside correction could terminate at the 3550 level, from which the bull run could resume.
Please plan your trade according to it.

Monday, December 11, 2006

Nifty for 11 Dec 06

These are my personal musings. These are not in any way meant to be trading advise. To view the full chart, right click and open in a new window.

Well, the bottle did break, finally.

Watching from a distance, it does seem that the RBI had something to do with it. The banks seem to have taken a major hit. And that seems to have triggered the negative sentiment.

My stop of 3980 has been triggered, and I would be out.

In most cases, such a sharp fall does have a knee jerk reaction upwards. The bottom fishers would be out, seeking to push the index up. The volumes on the Nifty future are almost close to the May and June bottoms.

Whenever we have seen such high volumes on the Nifty Future, we have always seen a convincing bottom.

How do we trade this? Simple … wait for 3872 to be violated on the upside, wait patiently for a downside move, and then go long, after a higher bottom has been established on the hourly chart.
The thumb rule levels are marked out on the chart.

Wednesday, December 06, 2006

Nifty for 06 Dec 06

These are my personal musings. These are not in any way meant to be trading advise. To view the full chart, right click here and open in a new window.

A new high looks like becoming a routine.

However, with every new high, profit booking is rearing its head. As a result, we are not seeing any sustained follow through buying. Let the profit booking happen.

For the longer term player, it could be the best possible thing to happen.

The Bank Nifty seems to now have given up its support, and may witness some more weakness. As mentioned earlier, this sector churn could lead to some volatility in the Index.

If we just step back, and see the chart, we do not notice any major weakness in the index, as of now.

The technicals still suggest that we could expect a short term target of 4120. The fib extension target posted earlier still holds at 4170. I would raise my “mental” stop to 3980, from where the Nifty bounced strongly.


Nifty for 05 Dec 06


These are my personal musings. These are not in any way meant to be trading advise. To view the full chart, right click and open in a new window.
How boring. A new high has again been achieved, once again.
It really is strange, how traders have doubts in their minds when they are holding positions. There is no evidence of any weakness and yet people ask me for my opinion on the market.
The Bank Nifty seems to have taken support, and about to bounce back. As a result, some sector churn could follow, leading to some volatility in the Index.
The technicals still suggest that we could expect a short term target of 4120. The fib extension target posted earlier still holds at 4170.

Monday, December 04, 2006

Nifty for 04 Dec 06


These are my personal musings. These are not in any way meant to be trading advise. To view the full chart, right click and open in a new window.
The Bull Run still remains intact. A new high has again been achieved.
A convincing support now lies at the support zone marked out on the chart. The Nifty still has maintained its upward trend.
On the other hand, sector indices like the Bank Nifty and the CNX IT show some signs of weakness. Leading us to believe that there could be a minor correction in the Nifty. The correction could be enough to allow bulls to believe that the bull run is over. In that case, the support level of 3970 will be tested.
If I was trading this market, I would maintain a stop of around 3960. If I was to re-enter this market, I would look at 3970, as an entry level, with a strict stop. In any case, the technicals still suggest that we could expect a target of 4120.

Saturday, December 02, 2006

Nifty for 01 Dec 06


These are my personal musings. These are not in any way meant to be trading advise. To view the full chart, right click and open in a new window.

The Bull Run remains intact. A new high has been maintained.

A convincing support now lies at the support zone marked out on the chart. The breakout was tested on the resistance zone and has successfully maintained its upward move.

This break also has more significance, because it has occurred on a weekend. Normally, on weekends, traders close their positions. This suggests that bears are still on the back foot, and this move is re-enforcing the might of the bulls.
According to the short term triangle break, we can expect a target of 4120.
Let us see how the next week pans out.

Thursday, November 30, 2006

Nifty for 30 Nov 06


These are my personal musings. These are not in any way meant to be trading advise. To view the full chart, right click and open in a new window.
As expected, bears did take a beating, but exactly at the eleventh hour of the expiration.
I have raised my mental stop for the Nifty at 3918, which level saw support. I expect the Nifty to test 3974 level mildly, and then react downward again. 3980 could be a good level where we may see short term resistance.
This is not a suggestion to short at 3980, only a suggestion to monitor that level. If that level is achieved, then a higher top would have been made, and would allow the bull run to be intact.

Tuesday, November 28, 2006

Nifty for 28 Nov 06


These are my personal musings. These are not in any way meant to be trading advise. To view the full chart, right click and open in a new window.

As warned yesterday, we did see some weakness in the index. Unfortunately, many people could not have taken advantage of it, because of the huge 30 point gap down open. At such a stage, a trader is always in two minds, whether or not the weakness will sustain or not.

In any case, the weakness could persist just for a couple of days, and I find support levels for the Nifty at 3913, 3880 and 3855. These levels would be monitored on a daily basis, as they are dynamic, and change with additional market information.

I would change my bullish view only if the previous bottom of 3794 is violated convincingly. Therefore, bears among us could please exercise caution.

Those among us who have exit long positions, could re-enter at lower levels, once any of these support zones exhibit a convincing bounce.

Monday, November 27, 2006

Nifty for 27 Nov 06


These are my personal musings. These are not in any way meant to be trading advise. To view the full chart, right click and open in a new window.
It has been quite a while since my last post, well, a shade over two weeks. The Nifty has not done anything which was not expected. Still I wonder how many people have made money in this last fortnight.
In a capsule, the previous historic high has been tested and violated. The expected target was achieved, and has been broken. The last deep correction was a shakeout of the bulls, where the previous top was retested.
Since then, all the patterns are still suggesting of good times to come for the bulls. I have yet to see a mad euphoric blow off rise on the index. This is good for the bull. He can still take advantage of the further expected rise.
We have still not seen a meaningful correction for the last rise, in terms of price. Please keep in mind that a correction does not necessarily need to be in price, but can also been in time.
What do I expect? There could be another foray by the bears this settlement expiry, which could be used by amateurs as an excuse to short. This shorting could cost them dearly, as the bulls still seem extremely strong.
By following the Fibonacci extensions, the next logical target for the Nifty Index falls at 4170.
Will it or won’t it? Let us see.
Till then, trade unemotionally, and keep happy.

Friday, November 10, 2006

Nifty for 10 Nov 06

As was suggested in my last post on Saturday, the Nifty has achieved a target of 3840 today, and has tried consistently to retest it.

As is normal, these targets are overshot somewhat.

Therefore, it is only prudent to expect the 3840 levels to be penetrated mildly, and then a minor correction to set in.

Bulls among us can now wait patiently for re-entering the market at lower levels.

Saturday, November 04, 2006

Nifty for 03 Nov 06


These are my personal musings. These are not in any way meant to be trading advise. To view the full chart, right click and open in a new window.

Fibonacci projections taken from the June bottom suggest that the next likely target for the Nifty could be 3840. The Nifty has respected this particular extension drawn on the chart. As can be seen from the arrows marked out, every level has been tested, and then broken.

Further, those levels have also extended support on the the subsequent downswings, as can also be seen on the chart.

Therefore, it gives additional weight to the levels marked out.

The probability is high, that the Nifty will receive some sort of selling pressure at the 3840 levels, before breaking it on the upside.

Thursday, October 26, 2006

Nifty for 26 Oct 06


These are my personal musings. These are not in any way meant to be trading advise. To view the full chart, right click and open in a new window.
As was suggested in my last post, the long holiday had taken its toll in shaking out some highly leveraged Bulls.
With the derivatives expiry, the market has been volatile, but the intermediate trend is still up. The volatility could now reduce.
The Nifty seems still on course to make a new historical high. With a higher top, higher bottom pattern in place in the extreme short term.
Use dips to go long? I have been suggesting this for a long time.

Monday, October 23, 2006

Nifty for Diwali

Hello Readers,

First of all, on the occasion of Diwali, here is wishing you all a very happy and properous new year to come.

With two holidays coming up, it is obvious that no serious trading commitments are being made.

The real technical position will clarify only when this roadblock is passed.

I have been mentioning all along that Diwali was going to be bright, and indeed, it has turned out so.

I hope you have taken advantage of it.

Friday, October 20, 2006

Nifty for 19 Oct 06


These are my personal musings. These are not in any way meant to be trading advise. To view the full chart, right click and open in a new window.

It has been a few days since I updated my blog. Nevertheless, nothing has changed since. The trend remains up. In fact, the first two charts are those of Friday the 13th, when the market gapped up.


The gap created last week, was tested today. Successfully, I may add. The gap is still open. I would seriously sit up and take notice only when the gap would be closed. That would tell me that the market is now facing pressure from the bears. As things stand today, the bulls already in the market, do not want the sidelined bulls to enter at lower levels. As a result, their endeavour will be not to allow the market down.

It was amusing to see a flurry of messages that shorting time has come. To those “top pickers”, I would very humbly suggest to wait for a confirmation of weakness, rather than try and sell at the market top.

Wednesday, October 11, 2006

Nifty for 11 Oct 06

These are my personal musings. These are not in any way meant to be trading advise. To view the full chart, right click and open in a new window.

As has been consistently suggested over the last week or so, the extreme short term trend has been biased down, while the intermediate trend is still up. The patterns forming on the Nifty hourly chart are also suggesting the same.

If the bottom of today holds, then it is forming a triangular consolidation pattern, which suggested that the bulls do not want to allow the would be bulls to enter at lower levels.

The highs of the last few days has also been violated, which I do not interpret as an extremely bullish sign, as this stage. It seems that the stops of the bears have been run today. Soon another foray of bull stop running may also occur.

In any case, from this price action of the Nifty, it does not seem that the previous bottom of 3510 is going to be violated. In fact, I am assuming that the lowest the Nifty would see at this stage is 3530.

Therefore, it is suggested to plan your trades according to that.

Tuesday, October 10, 2006

Nifty for 10 Oct 06


These are my personal musings. These are not in any way meant to be trading advise. To view the full chart, right click and open in a new window.
There still seems nothing more to add from yesterday’s analysis. The extreme short term trend is still down. The intermediate and long term trend is still up.
For longs, I would like to place my stops a little below 3510.
This type of volatile market will give jitters to both bulls as well as bears. How do we trade this market then? I have three options. (i) Enter at lower levels, (ii) short at higher levels, or (3) stay away.
We need to plan our strategy according to the time frame of our choosing and risk appetite. That is the basic essence of trading this volatile time.
And keep in mind, I still maintain that the probability still remains upwards.

Monday, October 09, 2006

Nifty Analysis for 09 Oct 06


These are my personal musings. These are not in any way meant to be trading advise. To view the full chart, right click and open in a new window.

The extreme short term trend is still down. However, if we step back just a little, we could notice a sideways correction, which is in the nature of consolidation.

Apart from this, there seems nothing more to add from Friday's analysis.

Quite a few people have contacted me directly on chat, saying that I am a fool, and I do not know the meaning or interpretation of certain technical patterns.

It does happen that we fall into the “classic pattern” syndrome. I would only suggest readers to please keep your mind open, and be prepared for any eventuality.

And keep in mind that the probability still remains upwards.

Thursday, October 05, 2006

Nifty for 5 Oct 06


These are my personal musings. These are not in any way meant to be trading advise. To view the full chart, right click and open in a new window.

I am human, and I was positively exultant when the market opened with a gap up. However, after I sit back and look at the chart at the end of the day, I need to plan my day ahead.

Stepping back a little, we must take note of the fact that the Nifty has run into the resistance zone. The probability is extremely high that the Index would indeed continue its upward journey. But we must be prepared for any eventuality. A stop for longs could be placed slightly below the low of yesterday.

Those among us, who are short, could wait for the marked out level, where most of the stops are going to be bunched together. However, I would not suggest readers to be short, as the Nifty has made a short term bottom, which is much higher than yesterday's low.


Prepare the fireworks for Diwali.

Wednesday, October 04, 2006

Nifty for 4 Oct 06


These are my personal musings. These are not in any way meant to be trading advise. To view the full chart, right click and open in a new window.

I have received many congratulatory messages both on the forums which I post on, and also in my mailbox.


Also, many messages have asked me what we should do next. For all those messages, I would thank each individual for their very kind words. Also through this medium, I would like to re-iterate that I am not in the habit of giving specific stock recommendations.

Also … I would like to caution bottom fishers not to get carried away by the “accuracy” of my projected levels.

All you need to do is to allow the market to tell you that it has indeed bottomed. Allow a higher bottom – higher top to be established, and then only go long.
If you ask me what my personal gut feel is? Yes, the Nifty should resume its upward trend from tomorrow onwards. All said and done, I am only a human being, and I could be mistaken.

Tuesday, October 03, 2006

Nifty as on 3 Oct 06


These are my personal musings. These are not in any way meant to be trading advise. To view the full chart, right click and open in a new window.

The Nifty has at last taken a breather. Which was expected. My stop for long has been triggered. Even so, the relevance of the short term support level is reinforced by the number of times that the Nifty has managed to claw back from lower levels. I am expecting this short term move to touch the 3530 levels. Normally, these short term technical levels are overshot mildly. Therefore, a level of 3515 would be a good level to watch out for. I am preparing to go long tomorrow or the day after, if and when I see the Nifty take support there.

Taking a look at individual stocks, we do not find any panic selling, and a mixed behaviour in some sectors. Which leads us to believe that there is going to be some sector churn leading up to the quarterly results.

It is at times like this, that some extra caution needs to be exercised.

Monday, October 02, 2006

Nifty as on 29 Sep 06


These are my personal musings. These are not in any way meant to be trading advise. To view the full chart, right click and open in a new window.
The Nifty is still making a steady upward pattern. Normally, on a short term scale, this pattern is considered extremely bullish, but not so after a steady rise.
There is not much more to add from Thursday's analysis. I still remain long. I had actually expected that my stop would be triggered. I was actually surprised that it was not. And from the pattern, the market is showing, it could go anyway.
I repeat, the market is not yet giving any signs of weakness, so why buck the trend and go short. Only die hard gamblers would attempt shorts at this point. Let the Nifty confirm weakness with a lower top and bottom, and shorting would be less riskier.

Thursday, September 28, 2006

Nifty analysis for 28 Sep 06


These are my personal musings. These are not in any way meant to be trading advise. To view the full chart, right click and open in a new window.
Oh Well, it was expected that there would be volatility today. On an intraday perspective the volatility was non existent. For derivatives expiration day, today could take the record for the least volatile day.
My stop has still not been triggered, so I still remain long, and now I still keep my stop at 3565. I actually expect that my stop would be triggered tomorrow. And I am prepared for it. My objective is not to try and beat the market, but to take my slice of the action.
The market is not yet giving any signs of weakness, so why buck the trend and go short? Only brace yourself for opportunities to go long.

Wednesday, September 27, 2006

Nifty Analysis for 27 Sep 06


These are my personal musings. These are not in any way meant to be trading advise. To view the full chart, right click and open in a new window.
The purists among us will be extremely angry that the Nifty did not achieve the 3610 target. Does not matter. After all, the high was just 7 points away.
I am keeping a trailing stop of 3565 on the Nifty for long positions, as that coincides with two techniques. One is the 3568 intraday low, and the other is the rising trendline. Again people could question me saying that if I am so bullish on the market, then why keep such a tight stop?
Two reasons … one is that my short term target is achieved, and the second is … nothing prevents me from going long again at higher levels. For the present, my prime objective is to lock in my profits.
And take a new look at the Index, once this derivatives settlement is over tomorrow.
I am also marking out the stops which readers could adopt, depending on their own trading styles.

Tuesday, September 26, 2006

Nifty Analysis for 26 Sept 06


These are my personal musings. These are not in any way meant to be trading advise. To view the full chart, right click and open in a new window.
The Nifty did give us a scare, and for some time, it seemed that our objective of 3570, mentioned in my analysis of 18 Sep 06, and again on Friday, will not be achieved.
Normally, a target is overshot, and this time, the Nifty has come out of a two day sideways consolidation pattern. Therefore, in all probability, this time too, the target of 3570 will be overshot handsomely.
After all, the 3610 target is not far away. And the way the Nifty is behaving, it looks like even this 3610 target will be overshot handsomely.
Obviously it may not be one way. But brace yourself for a nice ride.

Friday, September 22, 2006

Nifty analysis for 22 Sep 06


These are my personal musings. These are not in any way meant to be trading advise. To view the full chart, right click and open in a new window.
The high of the Nifty is just 10 points away from our objective of 3570, mentioned in my analysis of 18 Sep 06.
Also as mentioned yesterday, bulls would need to adopt some more guts and withstand the bear onslaught. As expected, the bears tried to reach the 3500 levels stops, but today the bulls were stronger. The surprise today was the Bank Nifty, which corrected more than expected. Apart from that, everything still seems to be right on course. In all probability, if the 3570 levels are breached, then we could expect the 3610 level to be reached.
One thing which is noticeable is that the volumes on the Nifty futures are rising when the Index is falling, which should give comfort to bulls.
Please remember, the weekend normally tends to skew things slightly out of shape.

Thursday, September 21, 2006

Nifty as on 21 Sep 06


These are my personal musings. These are not in any way meant to be trading advise. To view the full chart, right click and open in a new window.

From some of the comments which I read, it does seem that folks have indeed made the right decisions, at the right time. The Nifty is fast approaching our objective mentioned in my analysis of 18 Sep 06.

http://dusant.blogspot.com/2006/09/nifty-analysis-for-18-sep-06.html

Also as mentioned yesterday, the bears were waiting for a decisive breakout with their stops. As soon as those stops were triggered, the market cooled off and returned to consolidation mode.

Now another game is going to be set up. The market will now probably try and chase the stops of the bulls. Those stops are going to be around the 3500 levels. Therefore, bulls will need to adopt some more guts and withstand that onslaught.

Although I do not pay much attention to fundamental information, from what news is filtering in, it does seem that Diwali is going to be bright.

Wednesday, September 20, 2006

Nifty Analysis for 20 Sep 06


These are my personal musings. These are not in any way meant to be trading advise. The technical problem about the charts still does not seem to be resolved. The chart ... therefore ... is uploaded here.

http://img291.imageshack.us/my.php?image=200906fibretraceandprojos6.png]

There is one thing which I abhor saying is “I told you so”. Trading is only a matter of planning a trade and then trading that plan. Yesterday, a trading plan was presented, suggesting that long positions could be initiated, if the hourly Nifty chart showed a higher top and higher bottom formation.

Today, the Nifty gave enough opportunity for going long. The first hourly candle engulfed yesterday's black candle body. The second was enclosed between the high and the low of the first, with a long lower shadow. The third again made a higher top and bottom.

What more does a trader need to go long?

We have seen some short term bears being trapped at the breakout of the H&S trendline. Some longer term bears would still be waiting for higher stop. On an extreme short term basis, the Nifty has made a lower swing bottom yesterday, and has not as yet made a higher swing top today. Technically, this should still be termed as a downside correction. However, a break above yesterday’s high could allow the Nifty make another consolidation pattern, like an expanding triangle.

Whatever the direction the market takes, one thing is sure. In volatile times likes this, the premiums of options tend to inflate. Therefore, selling options could turn out quite profitable, whatever direction we want to adopt.

Tuesday, September 19, 2006

Nifty Analysis for 19 Sep 06

These are my personal musings. These are not in any way meant to be trading advise. To view the full chart, right click here. Due to technical reasons, I am unable to upload the chart at this blog today.
Yesterday, it was suggested that the conventional indicators were showing negative divergence and there was a strong possibility that the Nifty could correct downward. The trigger seems to be the news of a hedge fund collapsing. These sorts of panic triggers are unavoidable in the market, and therefore, it was suggested that tight stops should be adhered to and a hedge be created at higher levels. This could also be termed as a failure of the pattern.
http://www.traderji.com/58968-post49.html
http://dusant.blogspot.com/2006/09/nifty-analysis-for-15-sep-06.html
In fact, those among us who have guts of steel could use this opportunity to create fresh longs. The only conditions being that the temptation of bottom fishing should be avoided at all costs, and to allow the Nifty to make a convincing higher top/higher bottom pivot on the hourly charts.
At this point, the bottom of the inverted head also assumes huge importance, as that should act as a support in case this bull run should continue.

Monday, September 18, 2006

Nifty Analysis for 18 Sep 06


These are my personal musings. These are not in any way meant to be trading advise. To view the full chart, right click and open in a new window.
The loose inverted head and shoulder pattern seems to have been completed. The Nifty today did make a higher top also. The conventional indicators are now showing some negative divergence. Therefore, there is a strong possibility that the Nifty could correct downward from here. The Nifty futures volumes seem to be drying up, primarily because of the lack of volatility. There has not been enough upward or downward movement to allow stops to be triggered, either of the bulls or the bears.
A breakout of the H&S gives us a logical target, somewhere in the region of 3610, but on the other hand, there is a Fibonacci Level which falls around the 3570 level. Let us see how much strength is exhibited by the Nifty and when it is achieved.

Friday, September 15, 2006

Nifty Analysis for 15 Sep 06


These are my personal musings. These are not in any way meant to be trading advise. To view the full chart, right click and open in a new window.
It was mentioned yesterday that the sideways consolidation was an indication that the Bulls were about to move in slowly. The hourly chart shows a loose inverted head and shoulder pattern. The head was where the over leveraged bulls exit in panic.
The Nifty playing around in a tight zone between 3430 and 3480 does suggest that the Bulls now do not want to allow the “would be” bulls to enter at lower levels. At times like this, it is advisable have a hedged strategy with a long viewpoint, and sell a hedge at higher levels, just in case our analysis turns against us.
Looking at a few Nifty components, it does seem that the software stocks will now lead the Nifty to higher levels.
Enjoy the ride.

Thursday, September 14, 2006

Nifty as on 14 Sep 06


These are my personal musings. These are not in any way meant to be trading advise. To view the full chart, right click and open in a new window.
The Nifty seems to be making the right bullish noises. Even though, on the hourly charts, the immediate short term trend is down, the intermediate trend is still up. Today, it kept hammering away at the down sloping short term trend-line, trying to break out upwards. The selling pressure, however, managed to restrict it from moving up. The volumes on the Nifty Futures were pretty low because of the lack of volatility and the ranged movement for the whole day today.
From a short term technical point of view, this sort of sideways movement normally allows most conventional indicators to move down, which allows the market to get oversold. This allows the market to rebound, and continue its longer term direction once the consolidation is over.
As of now, it looks like India is going to have a very bright Diwali.

Wednesday, September 13, 2006

Nifty Analysis 13 Sep 06


These are my personal musings. These are not in any way meant to be trading advise. To view the full chart, right click and open in a new window.
Aah … the pleasure of being on a vacation.
I have been following the Nifty for the last month, but have not really hammered out the various levels. The fact is that the Nifty has been consistently making higher tops and bottoms since the last week of July. Therefore, it is easy to make a blanket statement that the mood is bullish. Since late July, for the first time, it has made two lower tops. And a lower bottom since its previous swing low. This action would put a lot of doubts in traders’ minds, whether or not, the mood is going to remain bullish or not.
If we see a higher bottom respecting an earlier significant bottom, we should conclude that the mood is indeed continuing bullish, and the Nifty is attempting another foray at clearing the 3480 hurdle.This conclusion also comes from the fact that most Nifty components are not displaying much weakness, and in fact, the banks seem to be gaining in strength.

Friday, August 18, 2006

Nifty Index updated on 18 August 06

These are my personal musings. These are not in any way meant to be trading advise. To view the full chart, right click and open in a new window.

The Nifty maintained its status quo, without much movement either way. On the extreme short term focus, the trend is still up. If we step back slightly, the daily chart is showing two uncertain candles, a star and a doji. If we step back even further, the weekly chart is showing an extremely bullish candle.

The rising window of Wednesday is still open.

A classic consolidation pattern going on.

On Thursday, we saw that the FIIs have been net sellers in the derivatives segment, whereas, huge money was pumped into the cash. This could lead us to assume that the action is now going to shift from the index stocks to the mid-caps, and small-caps.

Thursday, August 17, 2006

Nifty Index updated on 17 August 06

These are my personal musings. These are not in any way meant to be trading advise. To view the full chart, right click and open in a new window.

The Nifty is indeed showing signs of being tired. But so far it has not displayed any exhaustion. As mentioned yesterday, the Nifty is still struggling with the roadblock of apprehensive bulls, who had bought at higher levels, and are desperate to exit at breakeven. As a picture is better for explanations, I have marked it clearly out on the chart. The gap (rising window) on the daily chart is still open. Which reinforces the (still) bullish mood. It still seems that the market does not want the bulls who have been left out, to enter at lower levels.

I still maintain my long outlook, though I have tightened my stops for my long positions, I still am in no mood to short, until I get a confirmation.

Wednesday, August 16, 2006

Nifty Index updated on 16 August 06

These are my personal musings. These are not in any way meant to be trading advise. To view the full chart, right click and open in a new window.

In intervening holiday seems to have brought strong bullish emotions to the fore. The Index broke out up with a large gap. The breakout is more significant because it has moved out of an ascending triangle, which is considered to be an extremely bullish pattern. The high of today hit a roadblock due to profit booking. This profit booking is understandable, as a previous swing low on 16 May at 12:00 hrs registered a low of 3383. The previous demand zone normally exerts a supply resistance, as those who would have bought at higher levels, would be trying to exit at breakeven.

The turnovers on both BSE as well as the NSE were extremely good, again reflecting strong pent up demand. My personal trending indicators are still showing no weakness. True, the short term indicators are in overbought region, but that does not mean that the Index will collapse. It is natural to expect some mild correction.

The climb up of the Index over the last nine weeks has been laboured, no doubt, as it had to break through a lot of resistances. Now these very same resistances would turn as supports.

This brings as back to our mantra of buying on dips. And keep tight stops to lock in profits.

Monday, August 14, 2006

Nifty Index updated on 14 August 06

These are my personal musings. These are not in any way meant to be trading advise. To view the full chart, right click and open in a new window.

Again, there isn’t much to add from Friday’s chart. I have just stepped back a little, and shown where the Nifty was receiving resistance. I have marked out the zone and also the specific points.

The bulls are doing their best to keep the Nifty from correcting downwards. They do not want the “fence sitters” to now enter at lower levels. The “fence sitters” have still not entered the market in a buying frenzy.

In due deference to the 400+ points rise from 24th, I would suggest that those among us who have indeed entered at lower levels, could tighten stops, to lock in profits. That would allow us to keep the market from taking out our profits back.

Unfortunately, from all the messages I am reading on various blogs, groups and websites, I perceive that traders are getting more and more engrossed in day trading, rather than stepping back and looking at the larger picture.

The Nifty has come out from a huge resistance zone between 3170 and 3200. Which could imply more confidence on the bullish bias.

Friday, August 11, 2006

Nifty Index updated on 11 August 06

These are my personal musings. These are not in any way meant to be trading advise. To view the full chart, right click and open in a new window.

As suggested yesterday, there was a minor correction in the Nifty. The immediate earlier top, which had been exerting resistance, was retested today, and the Nifty managed to stay above it. On today’s chart, I have also marked out a previous supply zone, where the Nifty has earlier paused. It was on 26 May, that the Nifty has made an hourly top of 3277.60. That is one of the reasons that it is faltering again and again at these levels.

While scrolling through the individual charts of the Index’s components, we see the banks, auto, petroleum and some pharma stocks showing weakness, while some other heavyweight stocks seem to be taking over the mantle of strength.

With that in mind, we could be prepared for a choppy week ahead, especially with an intervening holiday on Tuesday.

Thursday, August 10, 2006

Nifty Index updated on 10 August 06

These are my personal musings. These are not in any way meant to be trading advise. To view the full chart, right click and open in a new window.
As was suggested yesterday, the upward momentum has slowed down for the Index. The short term trend is still up. We did see a crack in the short term trend, but the Index was quick to recover.
The momentum having slowed, the possibility still remains that we could see a downward correction. The correction may not be too deep, as we see strong volumes coming into the Nifty Future, on every dip.
In terms of analysis, today was a “nothing” day, where the price has done nothing much. And it is “nothing” days like today, which place doubts in traders’ minds. In candlestick terms, it is like a spinning top on the end of day chart. This leads to corrections. In conclusion, wait for corrections, and take full advantage of dips.

Wednesday, August 09, 2006

Nifty Index updated on 09 August 06

These are my personal musings. These are not in any way meant to be trading advise. To view the full chart, right click and open in a new window.
The Nifty chart clearly shows the upside breakout of the short term downtrend. As has been suggested all along, we could have been buying on dips. Today, the Nifty has achieved its short term objective of 3250+. Also the Sensex has almost achieved the Fibonacci retracement level of 11195. No doubt both the indices have reached their price objectives. It also leads me to believe that there could be a temporary halt here.
Further, normally, whenever there is an upside breakout, the prices tend to slip down on profit booking. This profit booking allows the price to test the breakout levels. If the breakout levels hold, then we could expect the longer term trend to continue up. Therefore, we may see some sort of downside correction from here.
But again, we have to step back a little and observe the woods, and not the trees.
The intermediate trend is still positive, and a downside correction, if any, would only be in the nature of the bears testing the waters.
As has always been maintained since the last six weeks, the patient traders can make money provided they time the market in their buying.
In conclusion, wait for buying opportunities, rather than rush in.

Tuesday, August 08, 2006

Nifty Index updated on 08 August 06

These are my personal musings. These are not in any way meant to be trading advise. To view the full chart, right click and open in a new window.
The market recovered quite sharply from the lows of yesterday. Even though we had a good up move, the extreme short term trend is still down. Since the intermediate trend is up, it was suggested in my earlier posts, to use the short term dips to buy. Please check my post of Friday …. Click here.
The Nifty is back in the zone of uncertainty, but this time around, it does seem to have gathered enough momentum to break out upwards. The markets are just waiting for a cue from the FOMC meet, and then take any decisive move.
Let us wait and watch.

Monday, August 07, 2006

Nifty Index updated on 07 August 06

These are my personal musings. These are not in any way meant to be trading advise. To view the full chart, right click and open in a new window.
As suggested on Friday, there was follow up weakness today, and the Nifty has indeed gone into a short term downtrend. Actually, no one is willing to take a directional call on the market, with the FOMC meeting coming up ahead. For those who are not aware, the FOMC meet is where the Govt. of USA decides whether or not to raise interest rates.
The boogie of interest rates has always loomed large on the markets, with most major Governments raising interest rates, thereby making borrowing of capital more expensive.
The charts too are reflecting the uncertainty in players’ minds. I have highlighted the sideways movement of the Nifty, where it played out for most of the day.
Therefore, the price action on Thursday and Friday will have a most crucial bearing on the future of the Indian markets.
With the price action of the past, we could expect support marked out at the 3050 to 3060 level.
Now is the time, when patience will pay rich dividends.

Friday, August 04, 2006

Nifty Index updated on 04 August 06

Disclaimer: These are my personal musings and only meant for entertainment, not as trading advise. To view the full chart, right click on the thumbnail and open in a new window.

The extremely short term chart is showing weakness after a long time. A lower top and lower bottom is showing up on the chart after 24 July 06. I have marked it out in red. We should therefore, sit up and take notice. The previous bottom (marked in green) was around the 3110 levels.
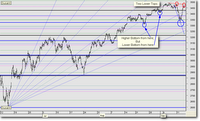
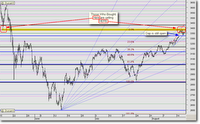
A break below 3162 could take the Nifty down to 3075, 3062 or 3051 levels. This could be the opportunity which longer term bulls are waiting for.

The higher the Nifty stops between the 3075 to 3051 levels, the stronger it will rebound upwards. It all will depend on how much time it takes to correct.

Extreme short term traders could look out for shorting opportunities on rises. The patient among us, with a slightly longer term horizon, could start committing small quantities of capital on dips to go long.


Nifty Index updated on 03 August 06

Disclaimer: These are my personal musings and only meant for entertainment, not as trading advise. To view the full chart, right click on the thumbnail and open in a new window.

We have seen a breakout of the Great Wall of resistance today. Is it a false breakout? Only time can tell as of today. The earlier resistances should act as support points, as the Nifty has still not made a lower top and lower bottom pattern as of now.

The crash of the last 90 minutes or so can be attributed to a knee jerk reaction to the Bank of England raising interest rates out of the blue. Or … the event may have been used as an excuse to run stops of bulls … who knows for sure?

The Nifty could resume its uptrend tomorrow when the news is assimilated and discounted. All said, I have been mentioning for the last week or so, to keep hedging, to avoid untoward capital losses.

Even now, the probability seems higher that the bulls will get back in action. And as they say, when the intermediate trend is up, use short term downside corrections to go long. I am still of the opinion that we could use dips to buy, until we see a technical breakdown.

Wednesday, August 02, 2006

Nifty Index updated on 02 August 06

Disclaimer: These are my personal musings and only meant for entertainment, not as trading advise. To view the full chart, right click on the thumbnail and open in a new window.

The Nifty is back in the “Zone”.

From the manner in which the Nifty is moving, we surmise that during the beginning of last month, there was cautious optimism. Later, there was a shakeout of the weaker bulls, who were leveraged to the full.

Once they were out of the system, we see that there has been a sharp bounce back up. This move may not have allowed the bulls to re-enter, due to the swiftness of the move. It does seem from the last three days, that accumulation is happening. The bulls are not allowing the price to fall beyond a reasonable level, which could make recovery impossible. Further, the sidelined bulls still seem to be waiting for a substantial correction, to enter long. These bulls, who have missed the bus, will start chasing the price, which could further fuel the bullishness. And as is common, they will be left holding the baby at higher levels.

At present there are no panic buttons being pressed, either by the bulls or the bears.

Both the camps are adopting a wait and watch attitude.

The dice still seems weighted in favour of the bulls at this point in time.