As usual, first the disclaimer: This is not trading advise. To view the full sized pictures, right click on the thumbnail and open in a new window.
I am glad that I had suggested readers to remain long. From a fundamental perspective, I thought that the hype and hoopla about the FOMC rate hike was overdone, and world over, markets were being traded in an uncertain manner with a bullish bias. India had a double whammy, with the derivatives expiration also on Thursday, 29 June.
And as is the case, when the event is aside, the markets heaved a collective sigh of relief and got back to business as usual.
From the technical aspect, on the hourly chart of the Nifty, we have not seen a significant swing low, which is below a previous swing low. The few retests of the lows are not really significant.
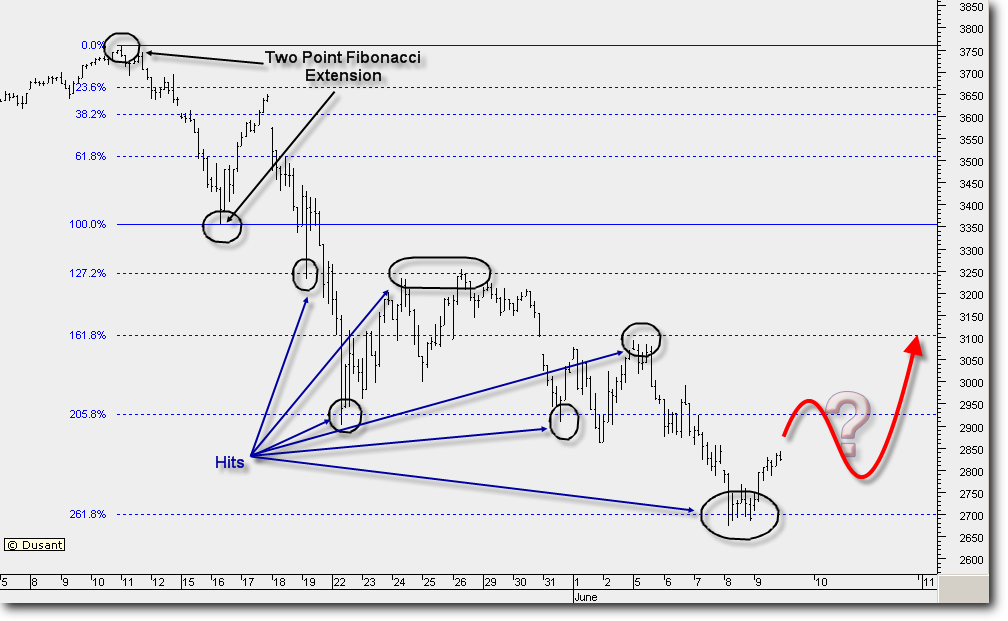 On 10 June, I had posted this chart at this address: http://tinyurl.com/owkqo.
It was expected that the Nifty could bottom at the 2700 levels, and then retest the 3100 levels. Subsequently, the Nifty went down to around 2600, and threw that chart out of the window. Later, the Nifty had violated a previous swing high by going up to the 2950 levels, which also coincided with a fibonacci cluster. Which tells us that the short-term trend had changed for the positive.
After that, we have not seen any substantial weakness. This type of move, when viewed in isolation, is bullish. However, I still am of the view that this 500+ points move is an upward retracement to the sharp fall of May. This type of market normally does not allow the bulls or the bears to make money, unless we take a slightly longer-term view.
So how could we continue trading this?
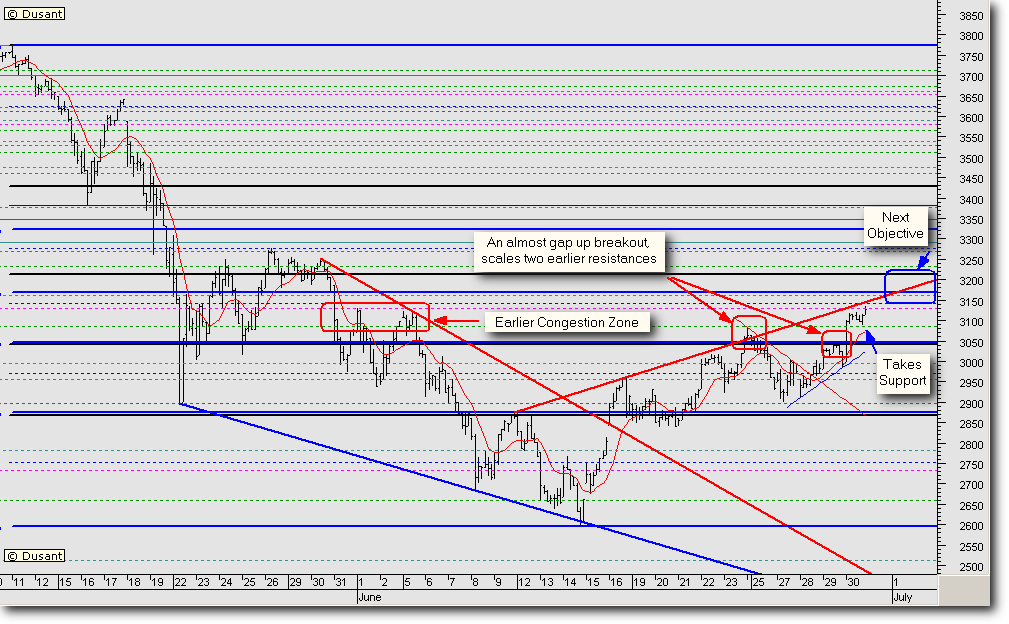
Today, the market opened (almost) with a gap, had a minor intraday retracement, which tested the previous high of 3068. The positive about today’s market was that it tried to close the “gap” of the opening, and stayed above the two resistance levels as marked out on the chart.
If we just glance back to the beginning of this month, we also notice that the Nifty had traded through a zone between the pink and green lines. That zone is marked on the chart as “earlier congestion zone”. Today, the Nifty has moved beyond that zone, and taken a first hesitant step above the dotted pink line.
Such a close at the end of the week, will not only make the end of day chart, but also the end of week chart look pretty bullish.
And we have been raising our objectives for the Nifty, as it takes step by slow step.
Now let us look at the flip side. The Index had taken 34 calendar days (24 trading days) from its all time high to the last bottom. It is 16 calendar days (12 trading days) since the bottom and it has not even retraced half of the loss.
That does not inspire too much confidence in this bull move.
Which brings us back to the original question – how do we trade this? It all depends on the time frame you are looking at. Keep booking profits on substantial rises, or sit tight, and keep raising stops to lock in profits.
And as I am fond of saying, trade happy, and you avoid mistakes.


