Friday, August 04, 2006

Nifty Index updated on 04 August 06

Disclaimer: These are my personal musings and only meant for entertainment, not as trading advise. To view the full chart, right click on the thumbnail and open in a new window.

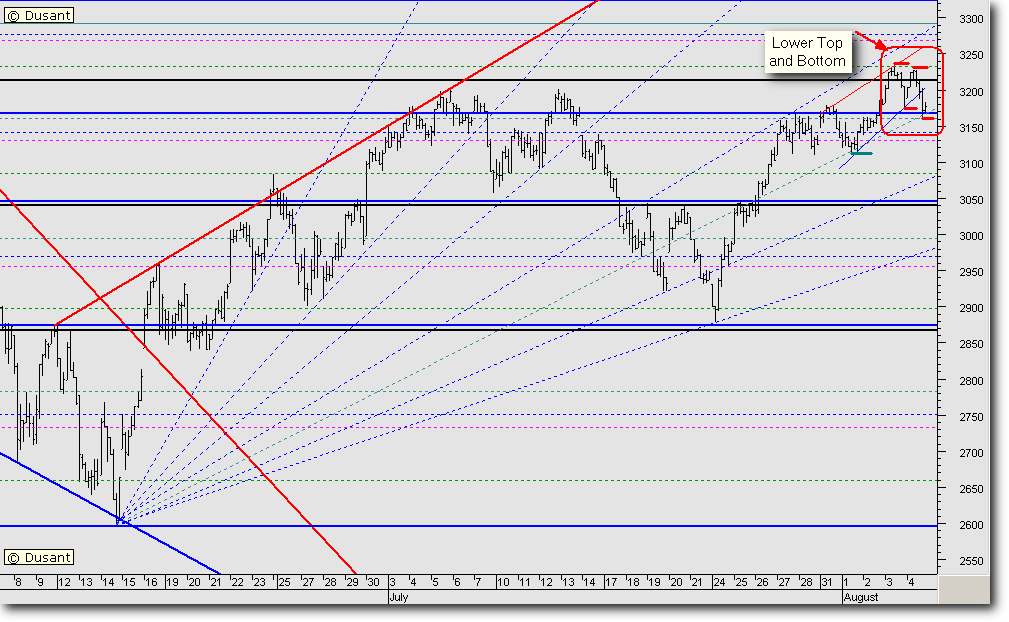
The extremely short term chart is showing weakness after a long time. A lower top and lower bottom is showing up on the chart after 24 July 06. I have marked it out in red. We should therefore, sit up and take notice. The previous bottom (marked in green) was around the 3110 levels.

A break below 3162 could take the Nifty down to 3075, 3062 or 3051 levels. This could be the opportunity which longer term bulls are waiting for.

The higher the Nifty stops between the 3075 to 3051 levels, the stronger it will rebound upwards. It all will depend on how much time it takes to correct.

Extreme short term traders could look out for shorting opportunities on rises. The patient among us, with a slightly longer term horizon, could start committing small quantities of capital on dips to go long.


Nifty Index updated on 03 August 06

Disclaimer: These are my personal musings and only meant for entertainment, not as trading advise. To view the full chart, right click on the thumbnail and open in a new window.

We have seen a breakout of the Great Wall of resistance today. Is it a false breakout? Only time can tell as of today. The earlier resistances should act as support points, as the Nifty has still not made a lower top and lower bottom pattern as of now.

The crash of the last 90 minutes or so can be attributed to a knee jerk reaction to the Bank of England raising interest rates out of the blue. Or … the event may have been used as an excuse to run stops of bulls … who knows for sure?

The Nifty could resume its uptrend tomorrow when the news is assimilated and discounted. All said, I have been mentioning for the last week or so, to keep hedging, to avoid untoward capital losses.

Even now, the probability seems higher that the bulls will get back in action. And as they say, when the intermediate trend is up, use short term downside corrections to go long. I am still of the opinion that we could use dips to buy, until we see a technical breakdown.

Wednesday, August 02, 2006

Nifty Index updated on 02 August 06

Disclaimer: These are my personal musings and only meant for entertainment, not as trading advise. To view the full chart, right click on the thumbnail and open in a new window.

The Nifty is back in the “Zone”.

From the manner in which the Nifty is moving, we surmise that during the beginning of last month, there was cautious optimism. Later, there was a shakeout of the weaker bulls, who were leveraged to the full.

Once they were out of the system, we see that there has been a sharp bounce back up. This move may not have allowed the bulls to re-enter, due to the swiftness of the move. It does seem from the last three days, that accumulation is happening. The bulls are not allowing the price to fall beyond a reasonable level, which could make recovery impossible. Further, the sidelined bulls still seem to be waiting for a substantial correction, to enter long. These bulls, who have missed the bus, will start chasing the price, which could further fuel the bullishness. And as is common, they will be left holding the baby at higher levels.

At present there are no panic buttons being pressed, either by the bulls or the bears.

Both the camps are adopting a wait and watch attitude.

The dice still seems weighted in favour of the bulls at this point in time.

Tuesday, August 01, 2006

Nifty Index updated on 01 August 06


Disclaimer: These are my personal musings and only meant for entertainment, not as trading advise. To view the full chart, right click on the thumbnail and open in a new window.

Not much to add from yesterday’s post.

The Nifty continues in a trading range, as suggested yesterday. We have had three retests of the 3110 levels within two trading sessions. That alone, enhances the significance of the level. The supply zone has still not been penetrated. The safety of the supply zone is now keeping the bears in a comfort zone. It would disturb the bears only when the 3200 levels are swept aside convincingly.

We could, therefore, expect action only when this Great Wall is cleared to the upside.

Monday, July 31, 2006

Nifty Index updated on 31 July 06

Disclaimer: These are my personal musings and only meant for entertainment, not as trading advise. To view the full chart, right click here and open in a new window.

On strong global cues, the Nifty opened with a gap. It kept hammering away at the upside Resistance Zone, almost throughout the day. Just goes to show how strong that resistance zone has become. On a low volumes day, coupled with some disappointing results from a couple of Index heavyweights, it tanked towards the end.

It really was a flattish kind of day. The Index has managed to keep above the previous swing low, which I have marked out in red. I have also marked out the rising swing tops in blue. This is a very short term observation.

With the mood being suddenly bearish in the last hour or so, we may see some extension selling tomorrow. Maybe the previous swing bottom could also be tested.

Now, stepping back a little, we will observe that the intermediate term trend is still up. The Nifty has not as yet violated any of those levels, which I depend on, using my personal indicators. And when the intermediate trend is up, and the short term trend inclines down, our reaction should be to buy on dips. In any case, the fact is that the Nifty has turned rather flat. And when the volatility narrows down, we normally tend to get a sharp move. It could be that we have a sharp move down! Bulls could use this opportunity to enter the market.

In case the Nifty does violate the low 3110 of a few days ago, the pattern could turn out to be an expanding triangle. An expanding triangle is one where the price makes two or three lower lows and higher highs. That is considered to be a bullish consolidation pattern. And usually, the price breaks out to the upside.

As I have been oft repeating, stops and/or hedging are a must when indices open gap up or down.

Finally, trade happy.

Sunday, July 30, 2006

Nifty Index updated on 28 July 06

Disclaimer: These are my personal musings and only meant for entertainment, not as trading advise. To view the full chart, right click on the thumbnail and open in a new window.

The Nifty traded sideways with a negative bias. Is it not to be expected, with a huge 200 points rise in just four trading sessions?

The roadblock ahead still holds.

Looking at the weekly chart, we see a side-by-side bearish and bullish candle. Normally this is considered to be an extremely bullish pattern. Further, I looked at the Heikin Ashi method of plotting the weekly Nifty, and the candle is a small bodied candle, with large shadows, which normally signals a change in trend.

On a weekly chart, the trend was down, and possibly, the trend may change to up. We also see a pick up in the total traded volumes on both the exchanges. This leads me to assume that, barring unforeseen circumstances, the trend is going to continue upwards.

Maybe this time, the Nifty will break out from the trading range roadblock?