Disclaimer: These are my personal musings and only meant for entertainment, not as trading advise. To view the full chart, right click on the thumbnail and open in a new window.
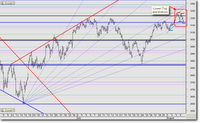
The extremely short term chart is showing weakness after a long time. A lower top and lower bottom is showing up on the chart after 24 July 06. I have marked it out in red. We should therefore, sit up and take notice. The previous bottom (marked in green) was around the 3110 levels.
A break below 3162 could take the Nifty down to 3075, 3062 or 3051 levels. This could be the opportunity which longer term bulls are waiting for.
The higher the Nifty stops between the 3075 to 3051 levels, the stronger it will rebound upwards. It all will depend on how much time it takes to correct.
Extreme short term traders could look out for shorting opportunities on rises. The patient among us, with a slightly longer term horizon, could start committing small quantities of capital on dips to go long.

No comments:
Post a Comment