Friday, July 21, 2006

Nifty Index updated on 21 July 06

These are my personal musings. These are not in any way meant to be trading advise. To view the full chart, right click on the thumbnail on the right, and open in a new window.

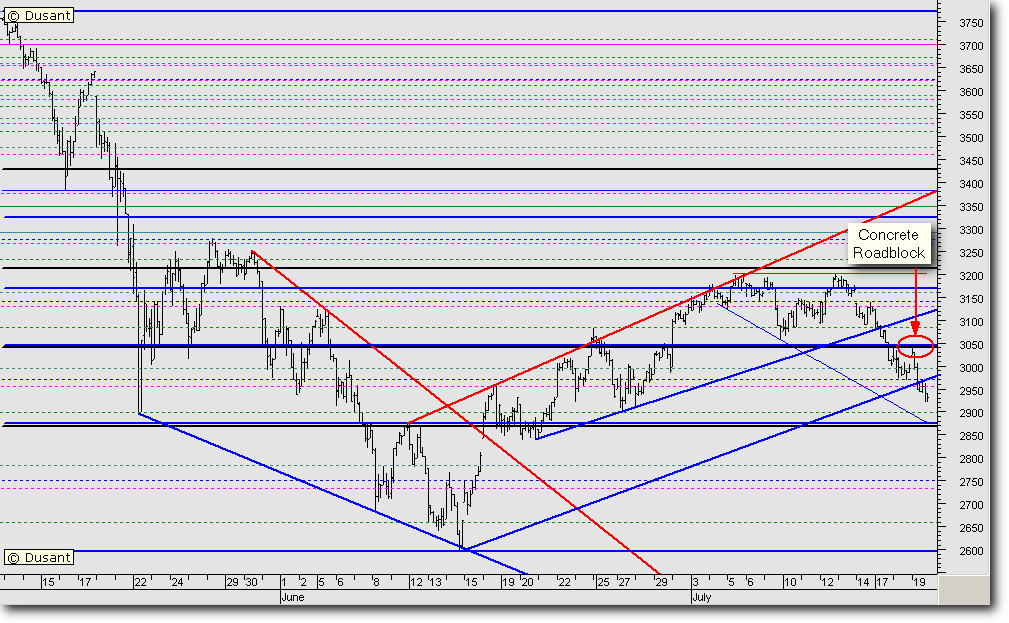
Contrary to expectation, the bears were indeed able to flex their muscles today. They also managed to close the rising window of yesterday. The bulls, however, managed to restrain the bears by keeping the Index above yesterday’s low of 2920. The Index went into a narrow congestion zone of 20 points in the last three trading hours.

The roadblock overhead still holds.

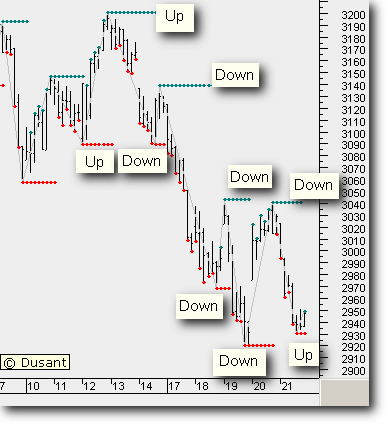
Now, let us take a look at the second chart. I have marked out the various peaks and troughs. I have marked out how the peaks and troughs were behaving in the last fortnight or so. After making a couple of higher troughs and peaks, the Index has continuously been making lower peaks and troughs.

Today’s low has been higher than the last trough. Therefore, for a bullish move to resume, today’s low of 2930 must be respected. Failing which, we can assume that yesterday’s sharp upward move was yet another bear market rally.

That means we could even see a projection level of 2880 to 2851.

The positive divergence confirmed at the 2920 level suggests that today’s bottom could hold, and we could see a bullish uptrend resuming from Monday.

It does seem a tricky situation to trade in, but then, trading in such volatile markets is never easy.

Trade happy.

Thursday, July 20, 2006

Nifty Index updated on 20 July 06

These are not in any way meant to be trading advise.
Yesterday, in my analysis, I had mentioned that the Nifty Future was showing a positive divergence, which could allow it to be a significant short term bottom. And that is how it seems to have turned out to be.
Is the Nifty still out of the woods? Much depends on how it turns out tomorrow. We have seen that there was selling pressure at higher levels. We have also seen that today, the volumes were lower than yesterday. Which puts a question mark on this rise. The Nifty opened with a bang, and went straight and hit yesterday's roadblock. As mentioned yesterday, these levels had been providing supports earlier, and now are turning formidable resistances.
The lower volumes suggest that the bears have not covered as yet. It also suggests that the bulls have not positioned themselves either.
On the hourly chart, there is a rising window, which the bears may try and close tomorrow. On the other hand, the bulls would not like bears to exit their existing short positions carried over from yesterday. Therefore, it all boils down to who has more muscle.
The probability suggests that, this time, the bulls could be at a temporary advantage. Which could lead to some more strength in the Index. But with so many resistances overhead, how long will the strength last, is anybody's guess.
Short term traders could trade long, but with strict and tight stops.

Nifty Index updated on 19 July 06

These are my personal musings. These are not in any way meant to be trading advise. To view the full chart, right click on the thumbnail on the right, and open in a new window.
The Nifty opened with a bang, and went straight and hit a concrete roadblock. These levels had been providing supports earlier, and now are turning formidable resistances.
It does not require a genius to pass a commentary on this chart, where we see a straight downhill ride all the way. Without a speed breaker on the way. Today, I have also included another blue line which is parallel to the red resistance line overhead. Even that has been violated. As a result, the sentiment is getting from worse to worst.
On the hourly charts, the futures are now showing some positive divergence, on reliable volume based indicators, which could allow this to be a significant bottom, while looking at the extreme short term trend.
There is a zone of support just 20 points below, which could provide temporary support to the Index. However, any retracements are now going to be met with renewed selling. Which is going to depress the sentiment further.
As has been suggested several times earlier, trade with the trend, and in volatile times like this, use hedging techniques to avoid calamitous movements of the market against your trade.

Back on track

We seem back on track, keep watching this space for more thrills and chills.
And ... as always ... trade happy.

Monday, July 17, 2006

Nifty Index updated on 17 July 06

Disclaimer: These are my personal thoughts and not trading advise. To view the full chart, right click on the thumbnail and open in a new window.
How the technical position changes within a span of two trading days. The Nifty opened with a downside gap, and continued down. We have readjusted the blue up sloping trendline to accommodate the minor incursions of the rising trend. This trendline, which has been providing strong support all along this rise, has been broken decisively today. A “loose” head and shoulder pattern has also taken effect on the hourly chart. The shoulders are marked “S” and the head “H”.
Now that the short term trend is down, any rises will be accompanied by heavy selling. Which will in turn depress the sentiment even more.
Unfortunately, for the index, it will now take huge buying to reverse its trend.
Now let us look at the positive side. Normally, we see that a sharp rise or drop like this is followed by profit booking covering, which allows the minor trend to reverse. In this case, we could see short covering. Further, the loose H&S pattern has almost completed its 100 point amplitude target.
We could therefore, see a minor upward reversal, which could allow the Nifty to test 3040 to 3065. From there, we could see further selling pressure which could push it down to approximately the 2930 levels. We could possibly see the index heavyweights bottoming around those levels, which could allow the Nifty to begin a fresh up move.
A couple of days back I had uploaded a projections chart. Here is the link in case the reader wants to refresh his/her memory - Right click here and open in a new window. The reader would notice that the projections were drawn up with the 3057 level as a base and 3147 as the minor pivot. Both these levels have been violated. Therefore, the earlier projections based on this chart, have been negated, and are discarded.
As of now, sell on rises could be the prudent thing to do.