Saturday, July 15, 2006

Nifty Index updated on 14 July 06

Disclaimer: These are my personal thoughts and not trading advise. To view the full chart, right click on the thumbnail and open in a new window.
Just when we had smugly thought that the market is behaving exactly as expected, it turns around and upsets the cart. On Thursday I had made a wistful statement, “why can’t the markets behave as expected everyday?”
Avid index watchers would certainly turn around and say, “on the daily data released by the NSE, we do not see a lower bottom.” And they would be correct. Basically, I have filtered out the opening spikes which allow the charts to be slightly skewed, and have considered the data where the Nifty has actually been traded.
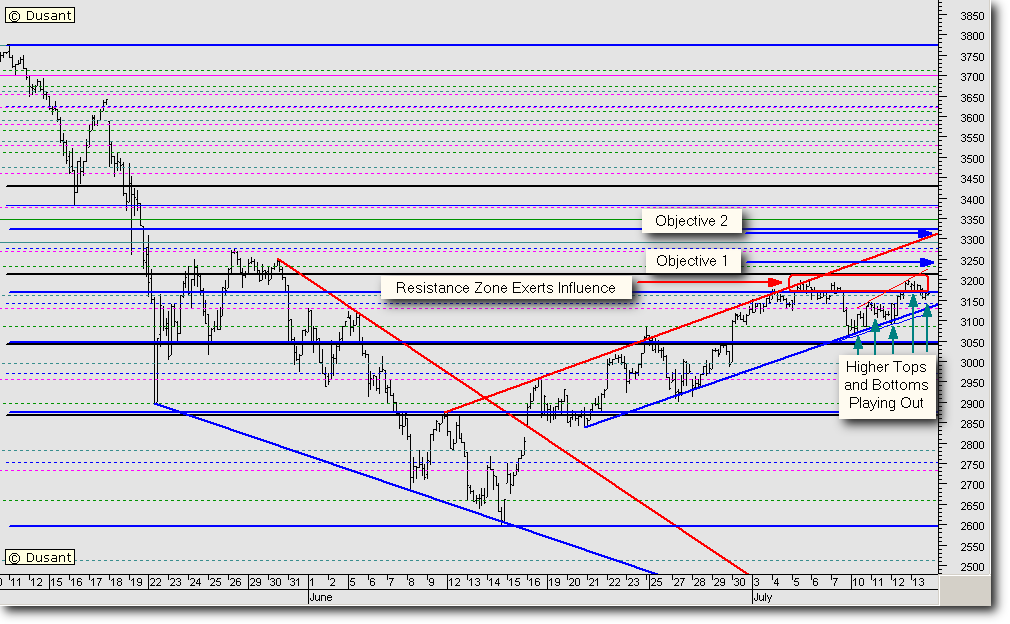
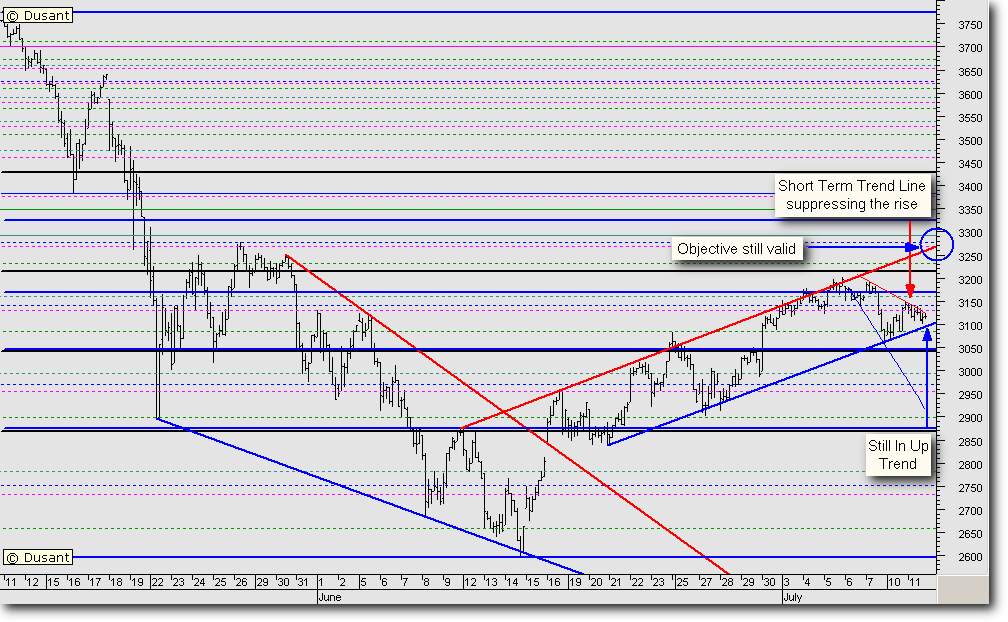
With Friday’s data in, it is very apparent, that the Nifty has finally broken the rising blue trendline. On its recovery path up, the same trendline has exerted resistance. The crack in the Nifty Future was even more pronounced than the Nifty Index. Further, what makes it seem even more bearish is the fact that the Index has gapped down, or what is termed as a falling window. Therefore, the projections of Thursday could be discarded for the time being.
As is a fact, a coin has two sides, so we will look at both the positive and negative aspects of the market.
The recent highs on the indices are not accompanied by volumes. This could be an indication that there has been no selling climax. On the other hand, volumes are rising on the Nifty Futures, and open interest is shooting through the roof.
What does that tell us? Things are not really what they seem to be. In all probability, there is a large scale arbitrage game being played between the cash and the futures.
So how could we trade this?
We could keep 3057 as a benchmark, where we could buy on dips. On the higher side, we could retain the 3200 level as the high mark to sell.
If the Nifty is unable to cross 3200 within two or three days on the upside, then we can assume that the uptrend has indeed terminated at 3200.
A closing below 3080 could further intensify selling pressure, which could allow the Nifty to test 3057 and 3025. Personally, I am trading with extremely tight stops, and my exposures are all hedged.
That is the only prudent way to go, when the market moves up 2% one day and 2% down, the second.

Thursday, July 13, 2006

Nifty Index updated on 13 July 06

Disclaimer: These are my personal thoughts and not trading advise. To view the full chart, right click on the thumbnail and open in a new window.

I would like to place on record, my humble thanks to all readers who “congratulated” me on yesterday’s analysis on chat. Also, the lone reader who has placed his comments on record. While being deeply satisfied with the way the market panned out today, I also felt a twinge, “why can’t the markets behave as expected everyday?”

The market moved just eight points above 3200. Exactly as anticipated.

The Index low was 3149, just nine points above the 3140 level, what was suggested yesterday.

If you have missed reading yesterday’s analysis, look for the link on the right column, labelled “Nifty Index updated on 12 July 06”.

If we zoom into the last couple of days, we see that so far, the Index is playing out with higher tops and bottoms. If we project the amplitude of the last couple of days, we see that the Index took support – exactly near the 38% retracement level, labelled point A. It overshot the previous swing high and faced resistance exactly near the 161.8% level, labelled point B. And again, it seems to have taken support today above the previous swing high at point C.

Considering these movements, we could project two upside levels near the 3245 and the 3295 levels. Mind you, these are not the Elliott Wave method of labelling, which I have annotated on the chart.

Therefore, readers could remain on high alert at these levels, and manage their trades accordingly.

And as always, trade happy.

Wednesday, July 12, 2006

Nifty Index updated on 12 July 06

Disclaimer: These are my personal thoughts and not trading advise. To view the full chart, right click on the thumbnail and open in a new window.

It does seem that the charts have followed the markets pretty well. The opening 30 minutes were hugely volatile as can be expected, with the shadow of yesterday’s terrorist events. The rising blue trendline was tested, where nervous bulls were shaken out.

The results of the bellwether, Infosys, ultimately pulled the day in favour of the bulls.

The short term (red) down sloping trendline was also retested on the hourly charts twice. Ultimately, the bulls prevailed.

Maybe these are a bit of philosophical ramblings, but as the heading says, these are my personal musings, so I will go ahead and take the liberty of talking a bit out of context of technical analysis.

During the entire day, I was getting euphoric messages that the Indian Stock markets have given a befitting reply to the terrorist attacks. However, before getting patriotically euphoric, let us look at the chart once more. It is telling us that the Nifty has come back into the same zone, where we have witnessed large scale profit booking earlier.

Therefore, it could be prudent to assume that we are going to see the same roadblock in the advance of the Index. However, as usually happens, generally euphoria makes the targets to be overshot. Therefore, it is my assumption, that the Index could face its first resistance, a few points above 3200. Then there could be a correction, which could allow the Nifty to then correct to the 3140 levels.

Bulls who are waiting on the sidelines could use this opportunity to enter long for the short term.

And as is usual, in such volatile markets, stops should be adhered to, to avoid calamities.

Summing up, it may be said that the longs have a better chance to be profitable.

Tuesday, July 11, 2006

Update on 11 July 06

The indomitable spirit of Mumbaikars is saluted. What more can an angry person say against this unnecessary death and destruction?

Mumbai tujhe salaam. (For non Indian Readers - Bombay I salute you)

Dusant

Nifty Index updated on 11 July 06

Disclaimer: These are my personal thoughts and not trading advise. To view the full chart, right click on the thumbnail and open in new window.

One of my well-wishers contacted me off this blog, and made a statement to the effect that the market is following my charts. For which I could only respond by saying that the markets do not follow the charts. We use the charts to follow the market.

Given the weak global cues, the markets did open weak, and kept following the down sloping trendline. The positive thing is that the markets did not just surrender to the bearish pressure. It kept its head above water. As long as the Nifty remains above the blue line, it makes sense to remain with a bullish view.

No doubt, the turnovers were low. That can be explained by the fact that major players would be waiting for the results of the big daddy of Indian markets, Infosys.

The blue up sloping trendline is still holding the price. Even though the trend for the day was weak.

In any case, we have not witnessed the aggressive hammering, which normally is associated with extremely negative sentiment. Further, from other studies, we also see that the sentiment is already deeply negative. And normally, we do not see the market tanking when the sentiment is already at a low ebb. At present, the market still seems on course with its tryst with destiny.

Keep your trading plan in place, and be prepared for unpleasant surprises, as we had in the case of Hero Honda today.

Monday, July 10, 2006

Nifty Index updated on 10 July 06

Disclaimer: These are my personal thoughts and not trading advise. To view the full chart, right click on the thumbnail and open in new window.

It was a foregone conclusion that the market would strengthen today, given the fact that it had tanked on Friday on false rumours.

Just goes to show how the market abhors uncertainty.

Anyway, as can be seen from the chart, the market did hold on the second line of defence and rallied forth. It has indeed clawed back into the congestion zone, where it has spent quite some time.

A short term retracement level placed at 3157 could be the first pause the market could take. A minor trendline at 3182 could be the second level where the Nifty could face stiff resistance. This level of 3182 also coincides with a 333% projection from a minor pivot.

Therefore, it could be suggested that traders could remain on high alert around that level.

If this trendline is violated towards the upside, then we could look at 3214. With such volatility still prevalent; it is always advisable to play the derivatives with hedged positions. Cash investors could commit small percentages of capital on diverse stocks and have a predetermined exit plan.

Trade happy. That way you make lesser mistakes.