Friday, July 28, 2006

Nifty Analysis for 27 July 06


Disclaimer: These are my personal musings and only meant for entertainment, not as trading advise. To view the full chart, right click on the thumbnail and open in a new window.

As was expected, the bullish run continued.

There was a minor hiccup during the day, but not enough to unnerve traders. The real test would now begin, where the Index will retest its earlier resistance zone.

And as is said in Technical Analysis, “till evidence to the contrary, the previous trend is assumed to continue”. Since the previous short term trend is bullish, we could continue to keep approaching the market with the same stance.

We also notice that earlier, the bears have been quite successful at the 3200 zone. Will they be beaten this time? It seems unlikely that they are going to give up easily.

However, if we step back and notice the forest rather than the trees, the weekly chart suggests a large bullish candle, for this week ending today. Therefore, we could assume that this time around the bears could be overwhelmed by the bulls.

Wednesday, July 26, 2006

Nifty Index updated on 26 July 06

Disclaimer: These are my personal musings and only meant for entertainment, not as trading advise. To view the full chart, right click on the thumbnail and open in a new window.

The Nifty finally held its head above the crucial bottleneck which was holding it back. There is not much to add to yesterday’s analysis. On the intraday charts, the Nifty is looking overbought, which could lead to some correction. But again, as mentioned yesterday, we are now on a “buy on dips” scenario.

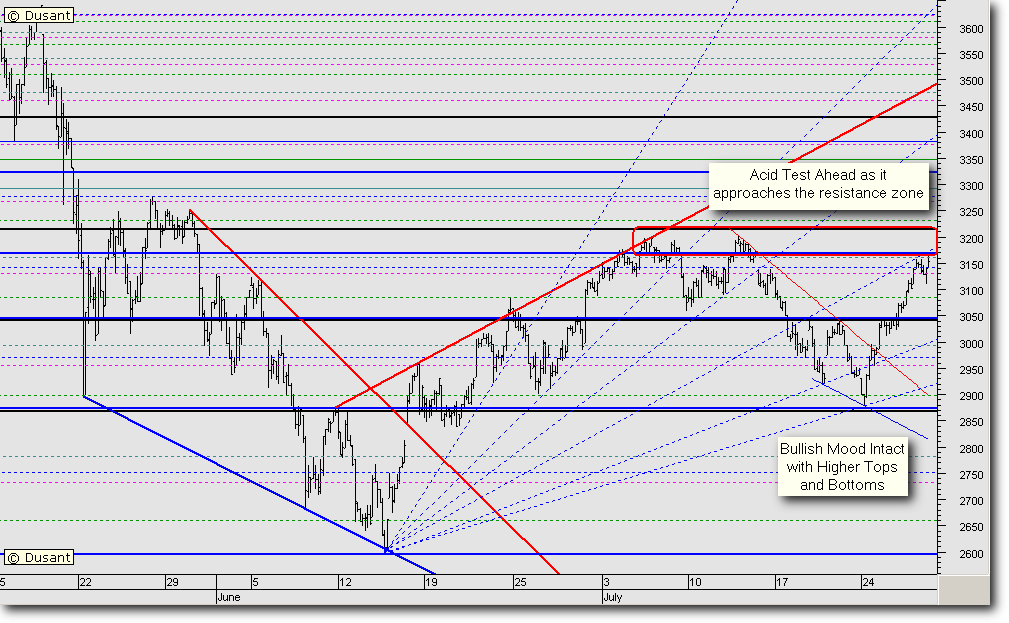
Also a notable thing on the Nifty futures chart is that 25 July was a rising window day. That rising window is still open, which adds further weight to the bullish scenario.

Today, the bears did have to run for cover. Then the active bulls managed to keep the index above the reach of those would-be bulls who were waiting on the sidelines. These fence sitter traders were hoping for a downside dip, which could allow them a “safer” long entry. However, as we know, the market does not have a habit of obliging. Towards mid-session, we saw these disappointed bulls chasing stocks. That added more bullish fuel.

It is normally observed, that when bulls start chasing stocks, the market has a habit of shaking them out. Also, the trend is unable to sustain itself for long. Further, we notice that in the last two months, we have not had a prolonged trend. The Nifty has trended up for a maximum of seven days in a row.

The 3188 level on the Nifty is now going to be a level to watch out for. Also 3038, 3047 and 2996 levels are technically crucial.

Going ahead, for the short term, we could see a correction till the 3070 levels, and a probable projected price target of 3143.

Please plan your trades accordingly.

Tuesday, July 25, 2006

Nifty Index updated on 25 July 06

Disclaimer: These are my personal musings and only meant for entertainment, not as trading advise. To view the full chart, click here.
As we have seen, time and again, the Nifty has again gone and tested the 3050 level once again, putting us squarely within that trading range.

The positive aspect is that the low of Monday is on the earlier congestion zone. Secondly it has just taken support on a Fibonacci retracement level of 48.6% of the entire rise from 2595 to 3208.
No doubt, the Nifty has made a higher top, above its immediately previous resistance level, but please remember, it has also made a lower bottom. To view the chart, click here.
This is not an ideally bullish scenario. An ideally bullish scenario would be that the Nifty corrects from here, makes a bottom above 2880, and then violates the high of today, which would be 3047 levels.
The broad market is indicating some more bullishness to come, but remember, the broad market cannot distinguish between a bear market rally and a genuine bull move.
As stated yesterday, selling into this rally indeed has been profitable. However, since the Nifty has made a higher top, we could be prepared to buy the dips now.
Obviously, it goes without saying that adequate stops should be adhered to, without which a person should not even dream of trading, let alone investing.

Monday, July 24, 2006

Nifty Index updated on 24 July 06

Disclaimer: These are my personal musings and only meant for entertainment, not as trading advise. To view the full chart, right click on the thumbnail and open in a new window.
As suggested on Friday, the Nifty opened below the low of Friday, and straightaway tanked to around 2880. For a memory refresh,
click here.
For the last few days, the Nifty is playing in two major congestion zones of 2870 and 3040. For ease of identification, I have marked them out on the chart. I also follow the minor trend for the Nifty, and we can see that the index has tested both, the lower as well as the upper ends of the down channel.

For the whole of last week, we have seen the Index trending down. It is also apparent in the supports and resistances chart alongside. Possibly, the minor trend has turned for the positive, as of now. A rough thumb rule to devise for it should be; that the Nifty must not trade below today’s low around 2880, and should continue to make higher tops, above the 3000 levels.
Looking at the negative sentiment prevailing in the market, it could just continue positive till the end of this week. In any case, we are just three trading sessions from the expiration of this derivatives settlement. Therefore, it is a foregone conclusion that volatility will rise even more.
Till we see evidence of a higher top and a bottom being established, selling on rises could be a “better” trading strategy.
In any case, those among us who have bought at higher levels could get an opportunity to exit.