Friday, August 04, 2006

Nifty Index updated on 04 August 06

Disclaimer: These are my personal musings and only meant for entertainment, not as trading advise. To view the full chart, right click on the thumbnail and open in a new window.

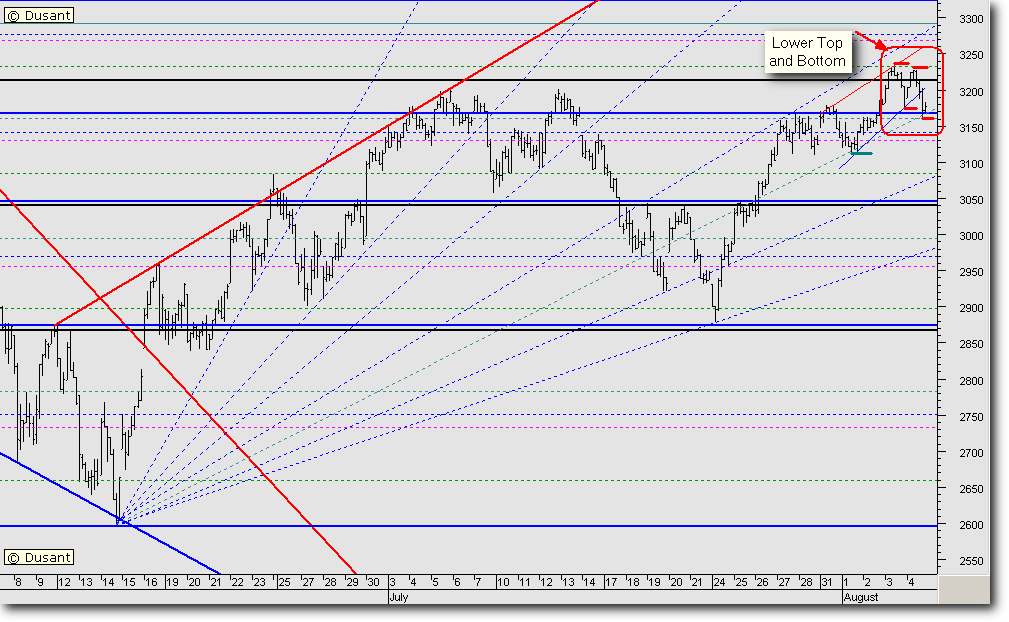
The extremely short term chart is showing weakness after a long time. A lower top and lower bottom is showing up on the chart after 24 July 06. I have marked it out in red. We should therefore, sit up and take notice. The previous bottom (marked in green) was around the 3110 levels.

A break below 3162 could take the Nifty down to 3075, 3062 or 3051 levels. This could be the opportunity which longer term bulls are waiting for.

The higher the Nifty stops between the 3075 to 3051 levels, the stronger it will rebound upwards. It all will depend on how much time it takes to correct.

Extreme short term traders could look out for shorting opportunities on rises. The patient among us, with a slightly longer term horizon, could start committing small quantities of capital on dips to go long.


Nifty Index updated on 03 August 06

Disclaimer: These are my personal musings and only meant for entertainment, not as trading advise. To view the full chart, right click on the thumbnail and open in a new window.

We have seen a breakout of the Great Wall of resistance today. Is it a false breakout? Only time can tell as of today. The earlier resistances should act as support points, as the Nifty has still not made a lower top and lower bottom pattern as of now.

The crash of the last 90 minutes or so can be attributed to a knee jerk reaction to the Bank of England raising interest rates out of the blue. Or … the event may have been used as an excuse to run stops of bulls … who knows for sure?

The Nifty could resume its uptrend tomorrow when the news is assimilated and discounted. All said, I have been mentioning for the last week or so, to keep hedging, to avoid untoward capital losses.

Even now, the probability seems higher that the bulls will get back in action. And as they say, when the intermediate trend is up, use short term downside corrections to go long. I am still of the opinion that we could use dips to buy, until we see a technical breakdown.

Wednesday, August 02, 2006

Nifty Index updated on 02 August 06

Disclaimer: These are my personal musings and only meant for entertainment, not as trading advise. To view the full chart, right click on the thumbnail and open in a new window.

The Nifty is back in the “Zone”.

From the manner in which the Nifty is moving, we surmise that during the beginning of last month, there was cautious optimism. Later, there was a shakeout of the weaker bulls, who were leveraged to the full.

Once they were out of the system, we see that there has been a sharp bounce back up. This move may not have allowed the bulls to re-enter, due to the swiftness of the move. It does seem from the last three days, that accumulation is happening. The bulls are not allowing the price to fall beyond a reasonable level, which could make recovery impossible. Further, the sidelined bulls still seem to be waiting for a substantial correction, to enter long. These bulls, who have missed the bus, will start chasing the price, which could further fuel the bullishness. And as is common, they will be left holding the baby at higher levels.

At present there are no panic buttons being pressed, either by the bulls or the bears.

Both the camps are adopting a wait and watch attitude.

The dice still seems weighted in favour of the bulls at this point in time.

Tuesday, August 01, 2006

Nifty Index updated on 01 August 06


Disclaimer: These are my personal musings and only meant for entertainment, not as trading advise. To view the full chart, right click on the thumbnail and open in a new window.

Not much to add from yesterday’s post.

The Nifty continues in a trading range, as suggested yesterday. We have had three retests of the 3110 levels within two trading sessions. That alone, enhances the significance of the level. The supply zone has still not been penetrated. The safety of the supply zone is now keeping the bears in a comfort zone. It would disturb the bears only when the 3200 levels are swept aside convincingly.

We could, therefore, expect action only when this Great Wall is cleared to the upside.

Monday, July 31, 2006

Nifty Index updated on 31 July 06

Disclaimer: These are my personal musings and only meant for entertainment, not as trading advise. To view the full chart, right click here and open in a new window.

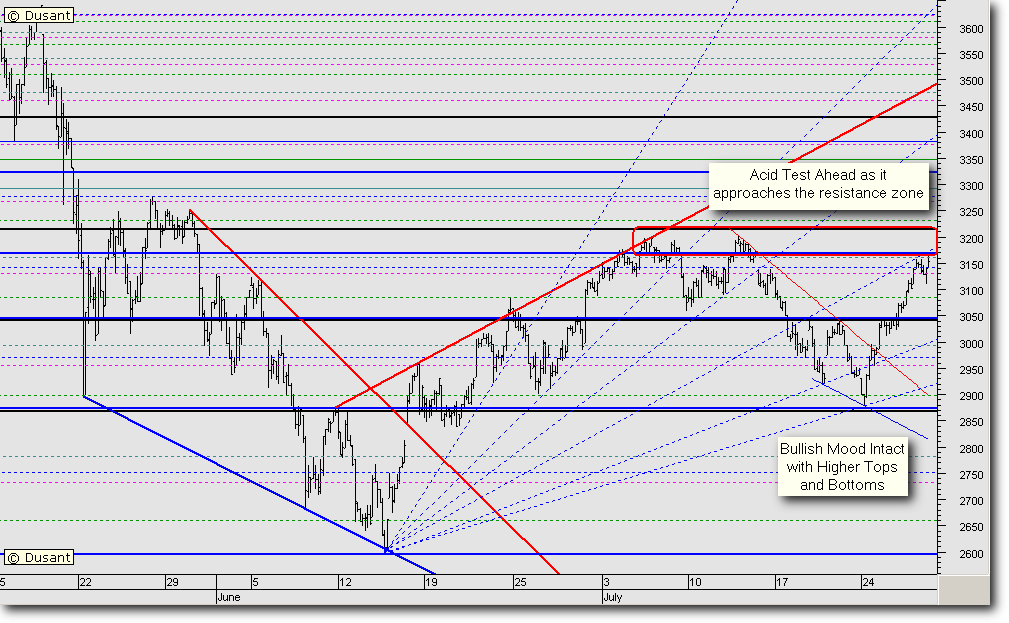
On strong global cues, the Nifty opened with a gap. It kept hammering away at the upside Resistance Zone, almost throughout the day. Just goes to show how strong that resistance zone has become. On a low volumes day, coupled with some disappointing results from a couple of Index heavyweights, it tanked towards the end.

It really was a flattish kind of day. The Index has managed to keep above the previous swing low, which I have marked out in red. I have also marked out the rising swing tops in blue. This is a very short term observation.

With the mood being suddenly bearish in the last hour or so, we may see some extension selling tomorrow. Maybe the previous swing bottom could also be tested.

Now, stepping back a little, we will observe that the intermediate term trend is still up. The Nifty has not as yet violated any of those levels, which I depend on, using my personal indicators. And when the intermediate trend is up, and the short term trend inclines down, our reaction should be to buy on dips. In any case, the fact is that the Nifty has turned rather flat. And when the volatility narrows down, we normally tend to get a sharp move. It could be that we have a sharp move down! Bulls could use this opportunity to enter the market.

In case the Nifty does violate the low 3110 of a few days ago, the pattern could turn out to be an expanding triangle. An expanding triangle is one where the price makes two or three lower lows and higher highs. That is considered to be a bullish consolidation pattern. And usually, the price breaks out to the upside.

As I have been oft repeating, stops and/or hedging are a must when indices open gap up or down.

Finally, trade happy.

Sunday, July 30, 2006

Nifty Index updated on 28 July 06

Disclaimer: These are my personal musings and only meant for entertainment, not as trading advise. To view the full chart, right click on the thumbnail and open in a new window.

The Nifty traded sideways with a negative bias. Is it not to be expected, with a huge 200 points rise in just four trading sessions?

The roadblock ahead still holds.

Looking at the weekly chart, we see a side-by-side bearish and bullish candle. Normally this is considered to be an extremely bullish pattern. Further, I looked at the Heikin Ashi method of plotting the weekly Nifty, and the candle is a small bodied candle, with large shadows, which normally signals a change in trend.

On a weekly chart, the trend was down, and possibly, the trend may change to up. We also see a pick up in the total traded volumes on both the exchanges. This leads me to assume that, barring unforeseen circumstances, the trend is going to continue upwards.

Maybe this time, the Nifty will break out from the trading range roadblock?

Friday, July 28, 2006

Nifty Analysis for 27 July 06


Disclaimer: These are my personal musings and only meant for entertainment, not as trading advise. To view the full chart, right click on the thumbnail and open in a new window.

As was expected, the bullish run continued.

There was a minor hiccup during the day, but not enough to unnerve traders. The real test would now begin, where the Index will retest its earlier resistance zone.

And as is said in Technical Analysis, “till evidence to the contrary, the previous trend is assumed to continue”. Since the previous short term trend is bullish, we could continue to keep approaching the market with the same stance.

We also notice that earlier, the bears have been quite successful at the 3200 zone. Will they be beaten this time? It seems unlikely that they are going to give up easily.

However, if we step back and notice the forest rather than the trees, the weekly chart suggests a large bullish candle, for this week ending today. Therefore, we could assume that this time around the bears could be overwhelmed by the bulls.

Wednesday, July 26, 2006

Nifty Index updated on 26 July 06

Disclaimer: These are my personal musings and only meant for entertainment, not as trading advise. To view the full chart, right click on the thumbnail and open in a new window.

The Nifty finally held its head above the crucial bottleneck which was holding it back. There is not much to add to yesterday’s analysis. On the intraday charts, the Nifty is looking overbought, which could lead to some correction. But again, as mentioned yesterday, we are now on a “buy on dips” scenario.

Also a notable thing on the Nifty futures chart is that 25 July was a rising window day. That rising window is still open, which adds further weight to the bullish scenario.

Today, the bears did have to run for cover. Then the active bulls managed to keep the index above the reach of those would-be bulls who were waiting on the sidelines. These fence sitter traders were hoping for a downside dip, which could allow them a “safer” long entry. However, as we know, the market does not have a habit of obliging. Towards mid-session, we saw these disappointed bulls chasing stocks. That added more bullish fuel.

It is normally observed, that when bulls start chasing stocks, the market has a habit of shaking them out. Also, the trend is unable to sustain itself for long. Further, we notice that in the last two months, we have not had a prolonged trend. The Nifty has trended up for a maximum of seven days in a row.

The 3188 level on the Nifty is now going to be a level to watch out for. Also 3038, 3047 and 2996 levels are technically crucial.

Going ahead, for the short term, we could see a correction till the 3070 levels, and a probable projected price target of 3143.

Please plan your trades accordingly.

Tuesday, July 25, 2006

Nifty Index updated on 25 July 06

Disclaimer: These are my personal musings and only meant for entertainment, not as trading advise. To view the full chart, click here.
As we have seen, time and again, the Nifty has again gone and tested the 3050 level once again, putting us squarely within that trading range.

The positive aspect is that the low of Monday is on the earlier congestion zone. Secondly it has just taken support on a Fibonacci retracement level of 48.6% of the entire rise from 2595 to 3208.
No doubt, the Nifty has made a higher top, above its immediately previous resistance level, but please remember, it has also made a lower bottom. To view the chart, click here.
This is not an ideally bullish scenario. An ideally bullish scenario would be that the Nifty corrects from here, makes a bottom above 2880, and then violates the high of today, which would be 3047 levels.
The broad market is indicating some more bullishness to come, but remember, the broad market cannot distinguish between a bear market rally and a genuine bull move.
As stated yesterday, selling into this rally indeed has been profitable. However, since the Nifty has made a higher top, we could be prepared to buy the dips now.
Obviously, it goes without saying that adequate stops should be adhered to, without which a person should not even dream of trading, let alone investing.

Monday, July 24, 2006

Nifty Index updated on 24 July 06

Disclaimer: These are my personal musings and only meant for entertainment, not as trading advise. To view the full chart, right click on the thumbnail and open in a new window.
As suggested on Friday, the Nifty opened below the low of Friday, and straightaway tanked to around 2880. For a memory refresh,
click here.
For the last few days, the Nifty is playing in two major congestion zones of 2870 and 3040. For ease of identification, I have marked them out on the chart. I also follow the minor trend for the Nifty, and we can see that the index has tested both, the lower as well as the upper ends of the down channel.

For the whole of last week, we have seen the Index trending down. It is also apparent in the supports and resistances chart alongside. Possibly, the minor trend has turned for the positive, as of now. A rough thumb rule to devise for it should be; that the Nifty must not trade below today’s low around 2880, and should continue to make higher tops, above the 3000 levels.
Looking at the negative sentiment prevailing in the market, it could just continue positive till the end of this week. In any case, we are just three trading sessions from the expiration of this derivatives settlement. Therefore, it is a foregone conclusion that volatility will rise even more.
Till we see evidence of a higher top and a bottom being established, selling on rises could be a “better” trading strategy.
In any case, those among us who have bought at higher levels could get an opportunity to exit.

Friday, July 21, 2006

Nifty Index updated on 21 July 06

These are my personal musings. These are not in any way meant to be trading advise. To view the full chart, right click on the thumbnail on the right, and open in a new window.

Contrary to expectation, the bears were indeed able to flex their muscles today. They also managed to close the rising window of yesterday. The bulls, however, managed to restrain the bears by keeping the Index above yesterday’s low of 2920. The Index went into a narrow congestion zone of 20 points in the last three trading hours.

The roadblock overhead still holds.

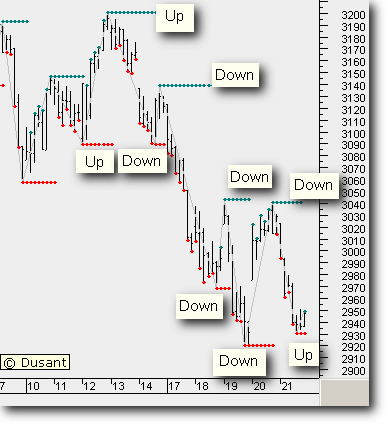
Now, let us take a look at the second chart. I have marked out the various peaks and troughs. I have marked out how the peaks and troughs were behaving in the last fortnight or so. After making a couple of higher troughs and peaks, the Index has continuously been making lower peaks and troughs.

Today’s low has been higher than the last trough. Therefore, for a bullish move to resume, today’s low of 2930 must be respected. Failing which, we can assume that yesterday’s sharp upward move was yet another bear market rally.

That means we could even see a projection level of 2880 to 2851.

The positive divergence confirmed at the 2920 level suggests that today’s bottom could hold, and we could see a bullish uptrend resuming from Monday.

It does seem a tricky situation to trade in, but then, trading in such volatile markets is never easy.

Trade happy.

Thursday, July 20, 2006

Nifty Index updated on 20 July 06

These are not in any way meant to be trading advise.
Yesterday, in my analysis, I had mentioned that the Nifty Future was showing a positive divergence, which could allow it to be a significant short term bottom. And that is how it seems to have turned out to be.
Is the Nifty still out of the woods? Much depends on how it turns out tomorrow. We have seen that there was selling pressure at higher levels. We have also seen that today, the volumes were lower than yesterday. Which puts a question mark on this rise. The Nifty opened with a bang, and went straight and hit yesterday's roadblock. As mentioned yesterday, these levels had been providing supports earlier, and now are turning formidable resistances.
The lower volumes suggest that the bears have not covered as yet. It also suggests that the bulls have not positioned themselves either.
On the hourly chart, there is a rising window, which the bears may try and close tomorrow. On the other hand, the bulls would not like bears to exit their existing short positions carried over from yesterday. Therefore, it all boils down to who has more muscle.
The probability suggests that, this time, the bulls could be at a temporary advantage. Which could lead to some more strength in the Index. But with so many resistances overhead, how long will the strength last, is anybody's guess.
Short term traders could trade long, but with strict and tight stops.

Nifty Index updated on 19 July 06

These are my personal musings. These are not in any way meant to be trading advise. To view the full chart, right click on the thumbnail on the right, and open in a new window.
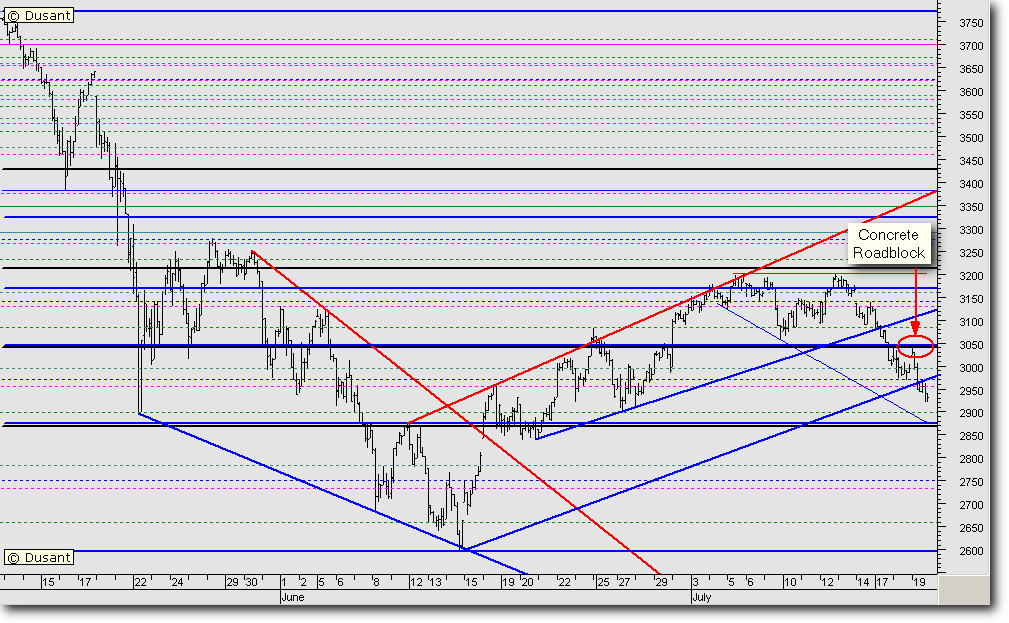
The Nifty opened with a bang, and went straight and hit a concrete roadblock. These levels had been providing supports earlier, and now are turning formidable resistances.
It does not require a genius to pass a commentary on this chart, where we see a straight downhill ride all the way. Without a speed breaker on the way. Today, I have also included another blue line which is parallel to the red resistance line overhead. Even that has been violated. As a result, the sentiment is getting from worse to worst.
On the hourly charts, the futures are now showing some positive divergence, on reliable volume based indicators, which could allow this to be a significant bottom, while looking at the extreme short term trend.
There is a zone of support just 20 points below, which could provide temporary support to the Index. However, any retracements are now going to be met with renewed selling. Which is going to depress the sentiment further.
As has been suggested several times earlier, trade with the trend, and in volatile times like this, use hedging techniques to avoid calamitous movements of the market against your trade.

Back on track

We seem back on track, keep watching this space for more thrills and chills.
And ... as always ... trade happy.

Monday, July 17, 2006

Nifty Index updated on 17 July 06

Disclaimer: These are my personal thoughts and not trading advise. To view the full chart, right click on the thumbnail and open in a new window.
How the technical position changes within a span of two trading days. The Nifty opened with a downside gap, and continued down. We have readjusted the blue up sloping trendline to accommodate the minor incursions of the rising trend. This trendline, which has been providing strong support all along this rise, has been broken decisively today. A “loose” head and shoulder pattern has also taken effect on the hourly chart. The shoulders are marked “S” and the head “H”.
Now that the short term trend is down, any rises will be accompanied by heavy selling. Which will in turn depress the sentiment even more.
Unfortunately, for the index, it will now take huge buying to reverse its trend.
Now let us look at the positive side. Normally, we see that a sharp rise or drop like this is followed by profit booking covering, which allows the minor trend to reverse. In this case, we could see short covering. Further, the loose H&S pattern has almost completed its 100 point amplitude target.
We could therefore, see a minor upward reversal, which could allow the Nifty to test 3040 to 3065. From there, we could see further selling pressure which could push it down to approximately the 2930 levels. We could possibly see the index heavyweights bottoming around those levels, which could allow the Nifty to begin a fresh up move.
A couple of days back I had uploaded a projections chart. Here is the link in case the reader wants to refresh his/her memory - Right click here and open in a new window. The reader would notice that the projections were drawn up with the 3057 level as a base and 3147 as the minor pivot. Both these levels have been violated. Therefore, the earlier projections based on this chart, have been negated, and are discarded.
As of now, sell on rises could be the prudent thing to do.

Saturday, July 15, 2006

Nifty Index updated on 14 July 06

Disclaimer: These are my personal thoughts and not trading advise. To view the full chart, right click on the thumbnail and open in a new window.
Just when we had smugly thought that the market is behaving exactly as expected, it turns around and upsets the cart. On Thursday I had made a wistful statement, “why can’t the markets behave as expected everyday?”
Avid index watchers would certainly turn around and say, “on the daily data released by the NSE, we do not see a lower bottom.” And they would be correct. Basically, I have filtered out the opening spikes which allow the charts to be slightly skewed, and have considered the data where the Nifty has actually been traded.
With Friday’s data in, it is very apparent, that the Nifty has finally broken the rising blue trendline. On its recovery path up, the same trendline has exerted resistance. The crack in the Nifty Future was even more pronounced than the Nifty Index. Further, what makes it seem even more bearish is the fact that the Index has gapped down, or what is termed as a falling window. Therefore, the projections of Thursday could be discarded for the time being.
As is a fact, a coin has two sides, so we will look at both the positive and negative aspects of the market.
The recent highs on the indices are not accompanied by volumes. This could be an indication that there has been no selling climax. On the other hand, volumes are rising on the Nifty Futures, and open interest is shooting through the roof.
What does that tell us? Things are not really what they seem to be. In all probability, there is a large scale arbitrage game being played between the cash and the futures.
So how could we trade this?
We could keep 3057 as a benchmark, where we could buy on dips. On the higher side, we could retain the 3200 level as the high mark to sell.
If the Nifty is unable to cross 3200 within two or three days on the upside, then we can assume that the uptrend has indeed terminated at 3200.
A closing below 3080 could further intensify selling pressure, which could allow the Nifty to test 3057 and 3025. Personally, I am trading with extremely tight stops, and my exposures are all hedged.
That is the only prudent way to go, when the market moves up 2% one day and 2% down, the second.

Thursday, July 13, 2006

Nifty Index updated on 13 July 06

Disclaimer: These are my personal thoughts and not trading advise. To view the full chart, right click on the thumbnail and open in a new window.

I would like to place on record, my humble thanks to all readers who “congratulated” me on yesterday’s analysis on chat. Also, the lone reader who has placed his comments on record. While being deeply satisfied with the way the market panned out today, I also felt a twinge, “why can’t the markets behave as expected everyday?”

The market moved just eight points above 3200. Exactly as anticipated.

The Index low was 3149, just nine points above the 3140 level, what was suggested yesterday.

If you have missed reading yesterday’s analysis, look for the link on the right column, labelled “Nifty Index updated on 12 July 06”.

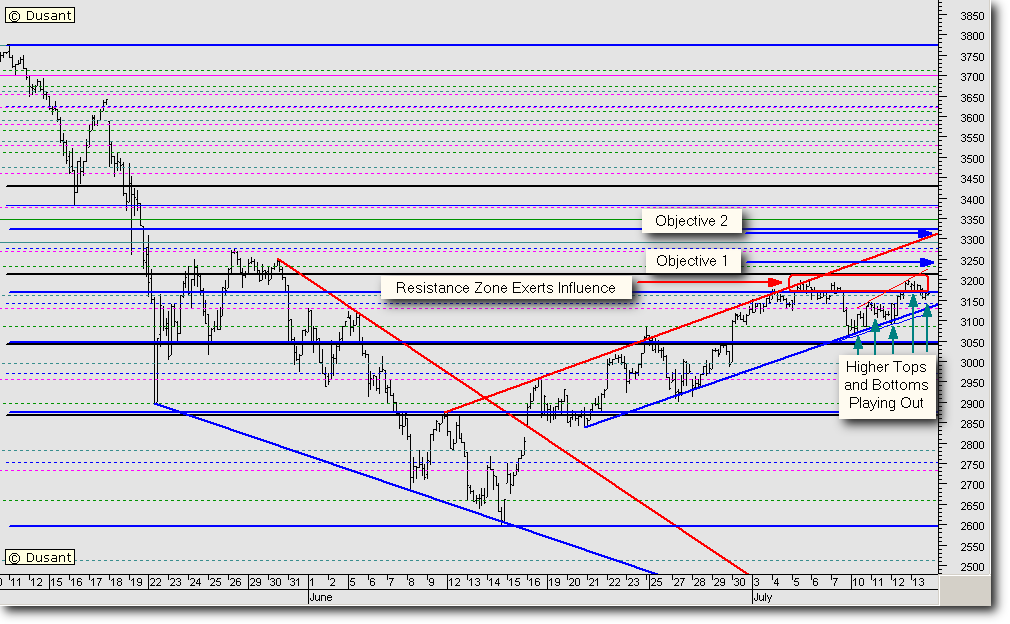
If we zoom into the last couple of days, we see that so far, the Index is playing out with higher tops and bottoms. If we project the amplitude of the last couple of days, we see that the Index took support – exactly near the 38% retracement level, labelled point A. It overshot the previous swing high and faced resistance exactly near the 161.8% level, labelled point B. And again, it seems to have taken support today above the previous swing high at point C.

Considering these movements, we could project two upside levels near the 3245 and the 3295 levels. Mind you, these are not the Elliott Wave method of labelling, which I have annotated on the chart.

Therefore, readers could remain on high alert at these levels, and manage their trades accordingly.

And as always, trade happy.

Wednesday, July 12, 2006

Nifty Index updated on 12 July 06

Disclaimer: These are my personal thoughts and not trading advise. To view the full chart, right click on the thumbnail and open in a new window.

It does seem that the charts have followed the markets pretty well. The opening 30 minutes were hugely volatile as can be expected, with the shadow of yesterday’s terrorist events. The rising blue trendline was tested, where nervous bulls were shaken out.

The results of the bellwether, Infosys, ultimately pulled the day in favour of the bulls.

The short term (red) down sloping trendline was also retested on the hourly charts twice. Ultimately, the bulls prevailed.

Maybe these are a bit of philosophical ramblings, but as the heading says, these are my personal musings, so I will go ahead and take the liberty of talking a bit out of context of technical analysis.

During the entire day, I was getting euphoric messages that the Indian Stock markets have given a befitting reply to the terrorist attacks. However, before getting patriotically euphoric, let us look at the chart once more. It is telling us that the Nifty has come back into the same zone, where we have witnessed large scale profit booking earlier.

Therefore, it could be prudent to assume that we are going to see the same roadblock in the advance of the Index. However, as usually happens, generally euphoria makes the targets to be overshot. Therefore, it is my assumption, that the Index could face its first resistance, a few points above 3200. Then there could be a correction, which could allow the Nifty to then correct to the 3140 levels.

Bulls who are waiting on the sidelines could use this opportunity to enter long for the short term.

And as is usual, in such volatile markets, stops should be adhered to, to avoid calamities.

Summing up, it may be said that the longs have a better chance to be profitable.

Tuesday, July 11, 2006

Update on 11 July 06

The indomitable spirit of Mumbaikars is saluted. What more can an angry person say against this unnecessary death and destruction?

Mumbai tujhe salaam. (For non Indian Readers - Bombay I salute you)

Dusant

Nifty Index updated on 11 July 06

Disclaimer: These are my personal thoughts and not trading advise. To view the full chart, right click on the thumbnail and open in new window.

One of my well-wishers contacted me off this blog, and made a statement to the effect that the market is following my charts. For which I could only respond by saying that the markets do not follow the charts. We use the charts to follow the market.

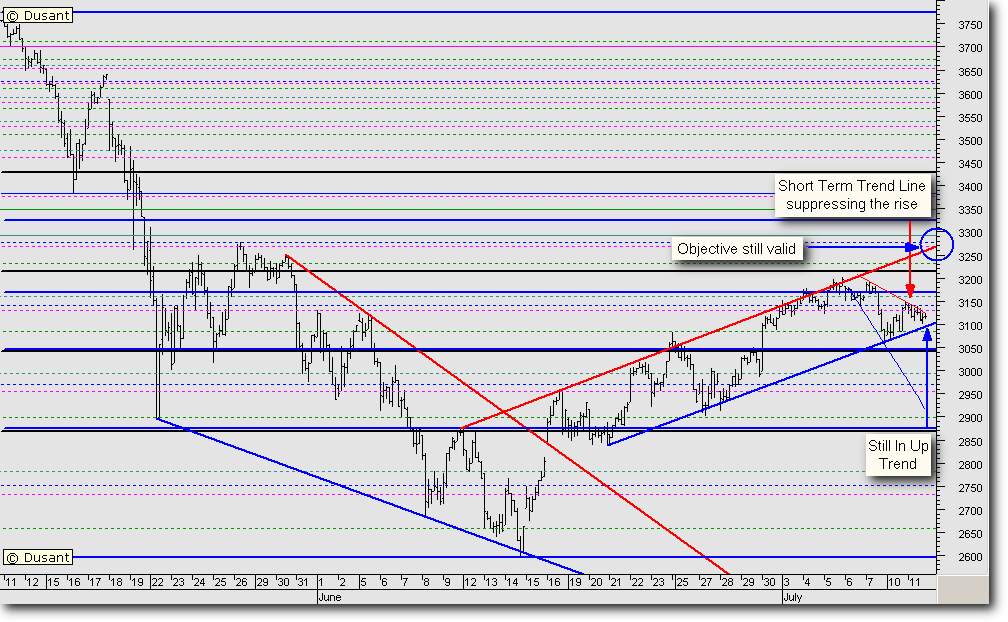
Given the weak global cues, the markets did open weak, and kept following the down sloping trendline. The positive thing is that the markets did not just surrender to the bearish pressure. It kept its head above water. As long as the Nifty remains above the blue line, it makes sense to remain with a bullish view.

No doubt, the turnovers were low. That can be explained by the fact that major players would be waiting for the results of the big daddy of Indian markets, Infosys.

The blue up sloping trendline is still holding the price. Even though the trend for the day was weak.

In any case, we have not witnessed the aggressive hammering, which normally is associated with extremely negative sentiment. Further, from other studies, we also see that the sentiment is already deeply negative. And normally, we do not see the market tanking when the sentiment is already at a low ebb. At present, the market still seems on course with its tryst with destiny.

Keep your trading plan in place, and be prepared for unpleasant surprises, as we had in the case of Hero Honda today.